According to our analysis EURUSD and USDJPY moved 58 pips and US30 moved 222 points on US BLS CPI (Consumer Price Index) data on 14 November 2023.
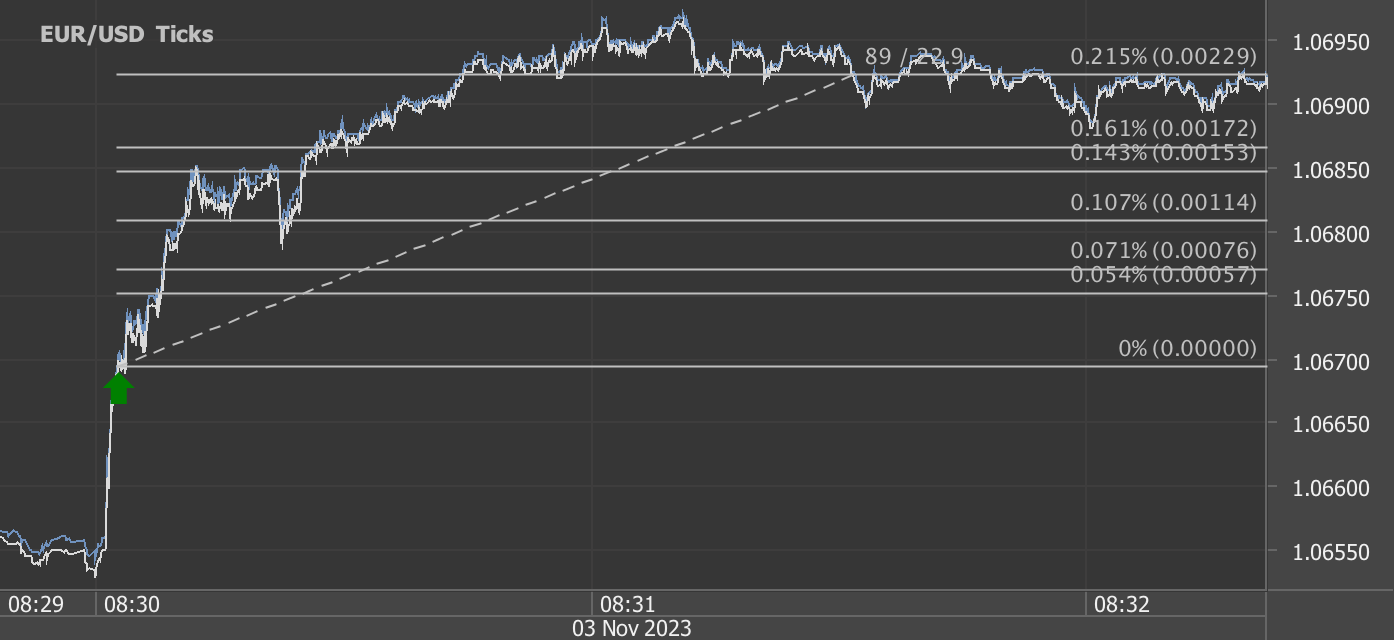
EURUSD (38 pips)

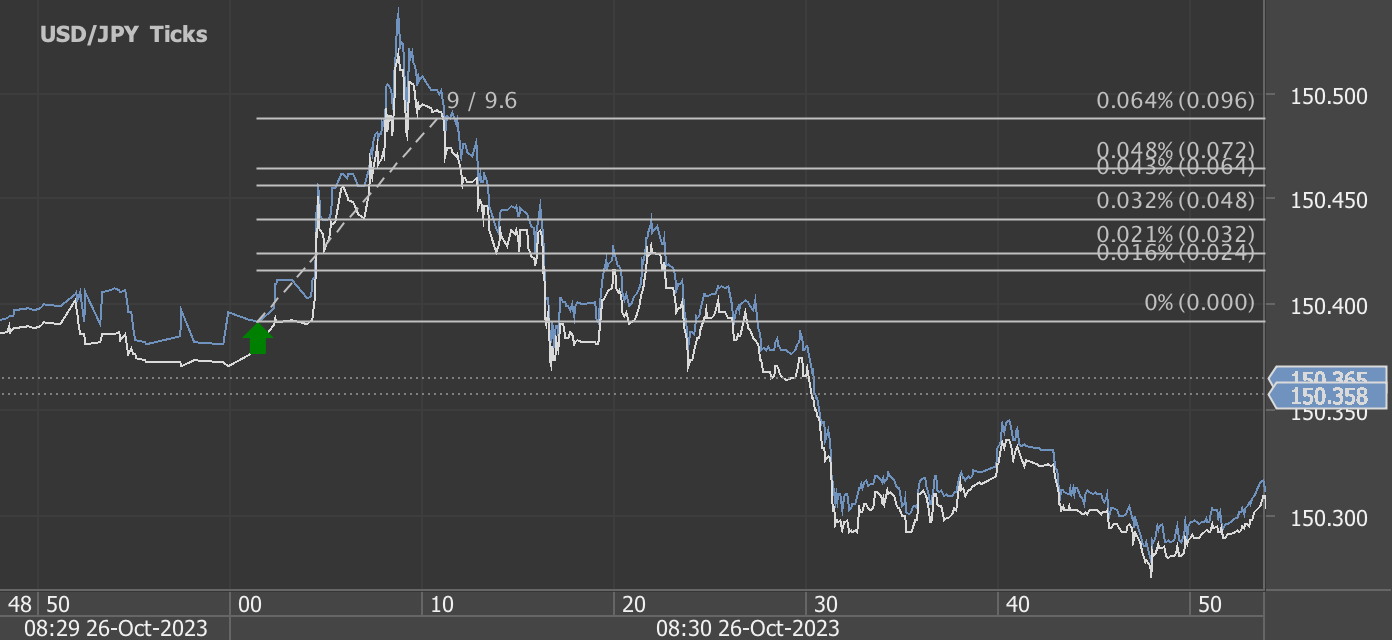
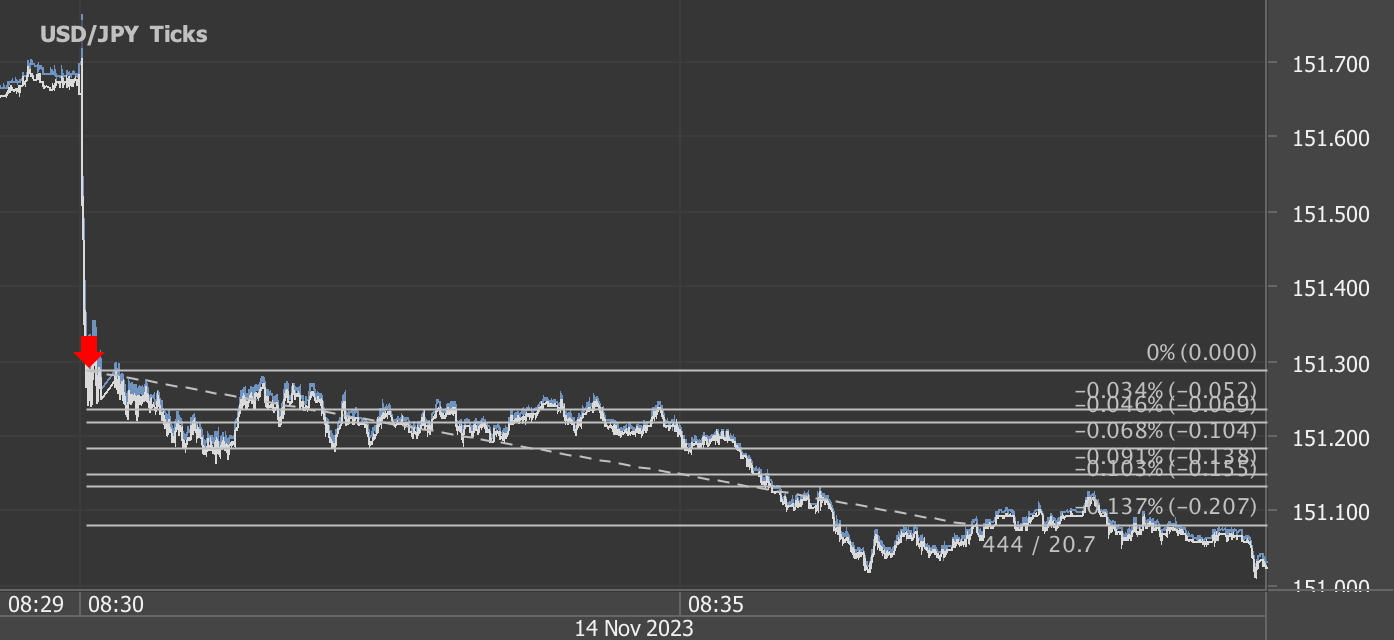
USDJPY (20 pips)
US30 (222 points)

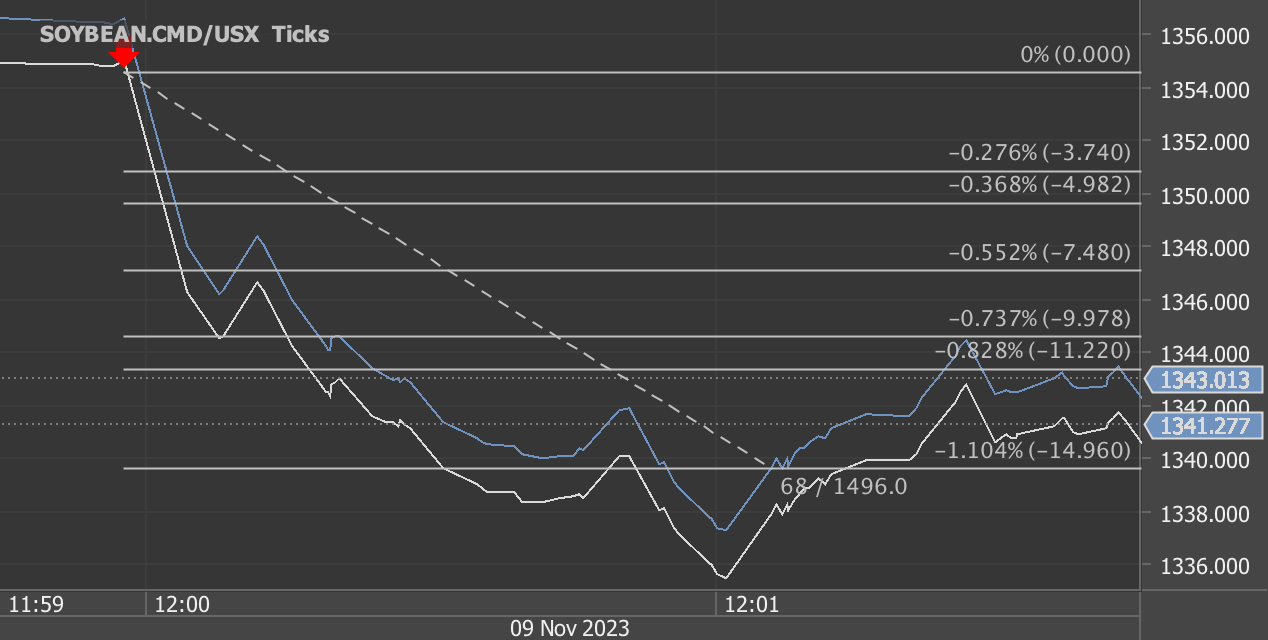
Charts are exported from JForex (Dukascopy).
The Consumer Price Index for All Urban Consumers (CPI-U) remained unchanged in October, following a 0.4 percent increase in September. Over the last 12 months, the all items index increased by 3.2 percent before seasonal adjustment.
Components:
Shelter: The index for shelter continued its upward trend, compensating for a decline in the gasoline index, resulting in a stable seasonally adjusted index for the month.
Energy: The energy index fell by 2.5 percent in October, largely due to a significant decline in the gasoline index. The energy index decreased by 4.5 percent over the last 12 months.
Food: The food index increased by 0.3 percent, with the index for food at home rising by 0.3 percent and food away from home rising by 0.4 percent.
All Items Less Food and Energy: This index rose by 0.2 percent in October, driven by notable increases in rent, owners' equivalent rent, motor vehicle insurance, medical care, recreation, and personal care.
Inflation Rates:
All Items: The all items index rose by 3.2 percent for the 12 months ending October, a smaller increase than the 3.7-percent rise for the 12 months ending September.
All Items Less Food and Energy: This index rose by 4.0 percent over the last 12 months, its smallest 12-month change since September 2021.
Energy: The energy index decreased by 4.5 percent for the 12 months ending October.
Selected Categories:
Food at Home: The index rose by 2.1 percent over the last 12 months.
Food Away From Home: The index rose by 5.4 percent over the last year.
Energy Commodities: Notable decline of 6.2 percent over the last 12 months.
New Vehicles: An increase of 1.9 percent.
Used Cars and Trucks: A decrease of 7.1 percent.
Notable Changes:
Shelter: The shelter index played a significant role in the monthly increase in the index for all items less food and energy.
Medical Care: The medical care index rose by 0.3 percent in October, with increases in hospital services and prescription drugs.
Transportation Services: Experienced an increase of 9.2 percent over the month.
Market Reaction: In response to this CPI data, the financial markets exhibited specific movements:
EURUSD: Demonstrated an upward movement of 38 pips, reflecting a stronger Euro against the US Dollar.
USDJPY: Experienced a downward movement of 20 pips, indicating a weaker US Dollar against the Japanese Yen.
US30 (Dow Jones): Showed an upward movement of 222 points, suggesting positive sentiment in the stock market.
Outlook: The all items index rose by 3.2 percent over the last 12 months. The next CPI for November 2023 is scheduled to be released on December 12, 2023.
This comprehensive overview combines CPI data, market reactions, and potential economic implications, providing a well-rounded understanding of the economic landscape in October 2023.
Start futures forex fx news trading with Haawks G4A low latency machine-readable data, one of the fastest machine-readable news trading feeds for US macro-economic and commodity data.
Please let us know your feedback. If you are interested in timestamps, please send us an email to sales@haawks.com.