According to our analysis USDJPY and EURUSD moved 13 pips on US Retail Sales data on 17 October 2023.
USDJPY (10 pips)

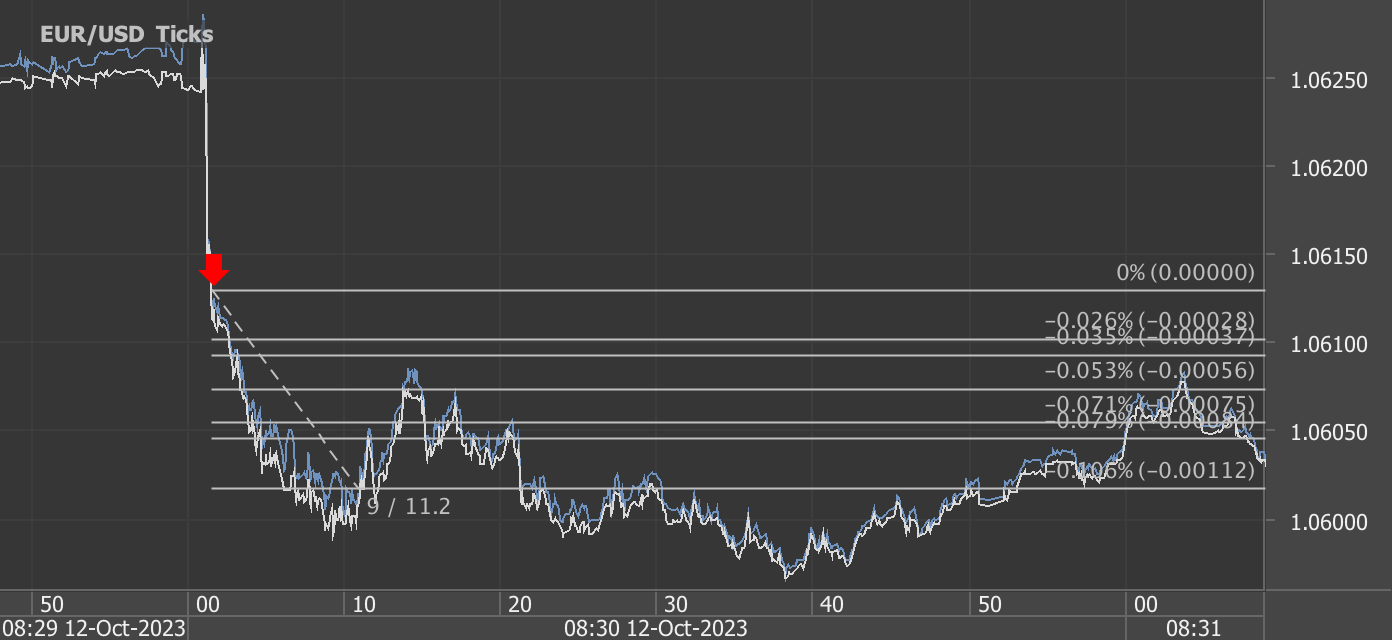
EURUSD (3 pips)

Charts are exported from JForex (Dukascopy).
Summary of U.S. Retail and Food Services Sales - September 2023
The advance estimates of U.S. retail and food services sales for September 2023 reveal significant insights into the nation's economic activity:
Total Sales: Adjusted for seasonal variations, as well as holiday and trading-day differences, total sales for September 2023 reached approximately $704.9 billion. This represents a notable increase of 0.7 percent from the previous month.
Year-on-Year Growth: Comparing September 2023 to the same month in 2022, total sales demonstrated substantial growth, showing an increase of 3.8 percent.
Quarterly Performance: Analyzing the July 2023 through September 2023 period in comparison to the same period a year earlier, sales exhibited a solid rise of 3.1 percent.
August 2023 Revision: The percent change between July 2023 and August 2023 was revised from an initial estimate of 0.6 percent to an upwardly adjusted figure of 0.8 percent.
Retail Trade: Retail trade sales in September 2023 increased by 0.7 percent compared to August 2023. Furthermore, retail trade sales saw a positive growth of 3.0 percent in comparison to September 2022.
Key Contributors: Nonstore retailers experienced substantial year-on-year growth of 8.4 percent, while food services and drinking places also demonstrated a notable increase of 9.2 percent when compared to September 2022.
These figures provide a snapshot of consumer activity, indicating positive trends in retail and food services sales. The data underscores the resilience and growth of the U.S. economy during this period.
Source: https://www.census.gov/retail/sales.html
Please let us know your feedback. If you are interested in timestamps, please send us an email to sales@haawks.com.
Start futures forex fx news trading with Haawks G4A low latency machine-readable data today, the fastest news data feed for US economic and commodity data.