According to our analysis natural gas moved 45 ticks on DOE Natural Gas Storage Report data on 23 May 2024.
Natural gas (45 ticks)

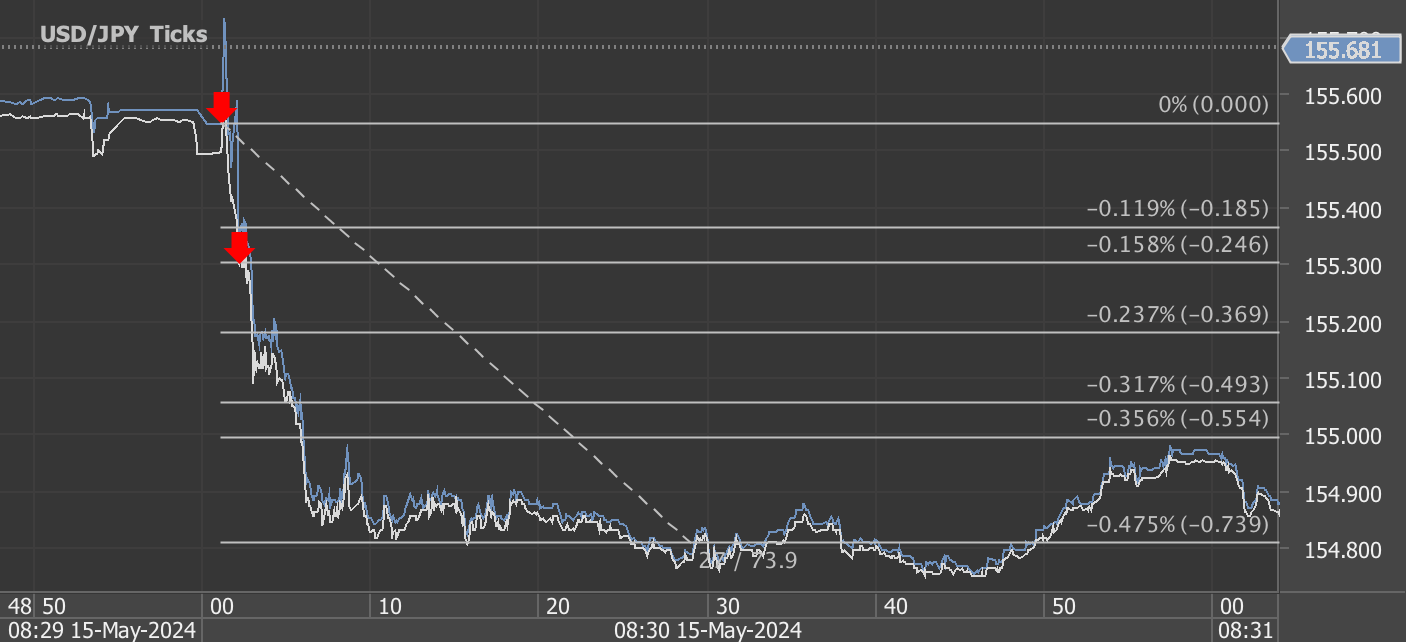
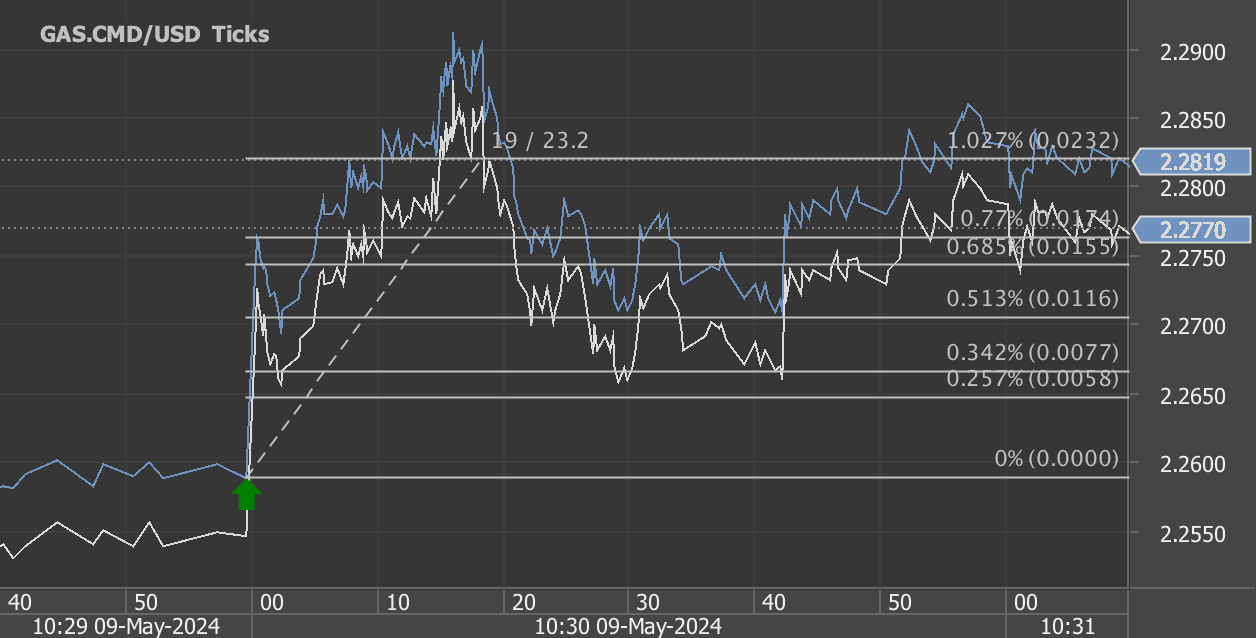
Charts are exported from JForex (Dukascopy).
Weekly Natural Gas Storage Update: Significant Inventory Growth
The latest data from the U.S. Energy Information Administration (EIA) for the week ending May 17, 2024, reveals a substantial increase in natural gas stocks, indicating strong trends in gas storage across the United States. Here's an insightful overview of the key findings from the report released on May 23, 2024.
Overview of Natural Gas Stocks
As of May 17, 2024, working gas in underground storage totaled 2,711 billion cubic feet (Bcf), marking a significant net increase of 78 Bcf from the previous week. This current stock is not only 402 Bcf higher than the same time last year but also 606 Bcf above the five-year average, which sits at 2,105 Bcf. These figures suggest a robust storage scenario that exceeds historical norms.
Regional Insights
The distribution of storage increases across the different regions is as follows:
East: Storage rose to 511 Bcf, up by 29 Bcf, reflecting a 6.5% increase from last year and a 28.1% surge over the five-year average.
Midwest: Here, stocks reached 628 Bcf, with a 22 Bcf increase from the previous week. This represents a 16.5% increase year-over-year and a 33.6% jump from the five-year average.
Mountain: Stocks stood at 202 Bcf, up 6 Bcf for the week, and showing the most significant percentage increase—71.2% from last year and 74.1% over the five-year average.
Pacific: Increased by 7 Bcf to 259 Bcf, up a dramatic 90.4% from last year and 27% from the five-year average.
South Central: The largest regional storage, tallying at 1,112 Bcf after a 15 Bcf increase, with a 7.2% rise from last year and 21.3% above the five-year average.
These figures point to a growing trend in natural gas storage, reflecting potential shifts in both market dynamics and consumption patterns.
Statistical Confidence
The EIA report also provides estimated measures of sampling variability. Notably, the coefficients of variation for stocks in regions like the East and Midwest are relatively low, indicating high confidence in these measurements. Specifically, the total coefficient of variation stands at 0.4%, demonstrating the robustness of the overall data.
Market Implications
This notable increase in gas stocks might influence natural gas prices and market strategies. Higher storage levels typically translate into more stable prices, but the current levels surpassing the five-year averages substantially could hint at potential downward pressures on natural gas prices in the short term.
Looking Ahead
As the storage levels continue to climb, market participants will be closely monitoring the trends for implications on supply and pricing. The next update, scheduled for release on May 30, 2024, will be eagerly awaited for further insights into the trajectory of natural gas storage and its broader economic impacts.
In summary, the natural gas storage report highlights a robust increase in stocks, well above year-ago and five-year average levels, signaling strong supply conditions and potential shifts in the energy market landscape. Stay tuned for further updates as the situation evolves.
Source: https://ir.eia.gov/ngs/ngs.html
Start futures forex fx commodity news trading with Haawks G4A low latency machine-readable data, one of the fastest data feeds for DOE data.
Please let us know your feedback. If you are interested in timestamps, please send us an email to sales@haawks.com.