Comment

33 ticks potential profit in 29 seconds on 15 May 2024, analysis on futures forex fx low latency news trading crude oil on DOE Petroleum Status Report data

According to our analysis crude oil moved 33 ticks on DOE Petroleum Status Report data on 15 May 2024.

Light sweet crude oil (17 ticks)

Brent crude oil (16 ticks)

Charts are exported from JForex (Dukascopy).


Analyzing the Latest Trends in U.S. Petroleum Data as of May 2024

The latest Weekly Petroleum Status Report from the U.S. Energy Information Administration provides key insights into the petroleum market for the week ending May 10, 2024. As energy markets fluctuate, this data is crucial for understanding the current state of supply, demand, and pricing within the sector.

Refinery Inputs and Capacity Utilization

U.S. crude oil refinery inputs showed a significant increase, averaging 16.3 million barrels per day, up by 307,000 barrels from the previous week. This indicates a robust demand for refining capacity, which operated at an impressive 90.4% of its total available capacity. This high utilization rate suggests that refineries are ramping up operations possibly in response to anticipated demand or attractive margins on refined products.

Production Increases

Both gasoline and distillate fuel production saw increases last week. Gasoline production rose to an average of 9.7 million barrels per day, while distillate fuel production, which includes diesel and heating oil, also increased to 4.8 million barrels per day. These increases are indicative of refineries adjusting outputs to meet shifting market demands or to replenish inventories.

Import and Inventory Shifts

Interestingly, U.S. crude oil imports averaged 6.7 million barrels per day last week, marking a decrease of 226,000 barrels per day compared to the previous week. Over the last four weeks, however, imports have shown an overall increase of 7.1% compared to the same period last year. This rise could be attributed to various factors including pricing arbitrage opportunities or efforts to bolster reserves.

U.S. commercial crude oil inventories decreased by 2.5 million barrels, underscoring a drawdown that positions current stocks about 4% below the five-year average for this time of year. This reduction in crude inventories could be a sign of stronger demand or a strategic inventory management by market participants.

Fuel Stock and Prices

While total motor gasoline inventories slightly declined, distillate fuel inventories experienced a slight decrease, staying about 7% below the five-year average. This lower inventory level for distillates might signal tightness in the diesel market, possibly leading to higher future prices if the trend continues.

Propane/propylene inventories increased by 2.9 million barrels and are notably 14% above the five-year average. This could be due to lower demand or increased production, leading to higher stocks.

Price Movements

The price for West Texas Intermediate crude settled at $79.81 per barrel, marking a modest increase from the previous week and a significant rise compared to last year. Retail gasoline prices have seen a decline from last week, although they remain slightly higher than the previous year's figures. This could reflect the recent changes in crude prices and refinery outputs.

Conclusion

The data from the week ending May 10, 2024, highlights several important trends in the U.S. petroleum market. Increased refinery output and capacity utilization coupled with fluctuating imports and inventories suggest a dynamic market adjusting to both domestic and international pressures. Prices are reflecting these shifts, with notable implications for consumers and businesses alike. As the market continues to evolve, it will be important to monitor these trends for a deeper understanding of the broader economic landscape influenced by energy commodities.

Source: https://www.eia.gov/petroleum/supply/weekly/pdf/highlights.pdf


Start futures forex fx crude oil news trading with Haawks G4A low latency machine-readable data, one of the fastest data feeds for DOE Petroleum Status Report data.

Please let us know your feedback. If you are interested in timestamps, please send us an email to sales@haawks.com.

Comment

Comment

104 pips potential profit in 33 seconds on 15 May 2024, analysis on futures forex fx news trading USDJPY and EURUSD on US Retail Sales and US BLS CPI data

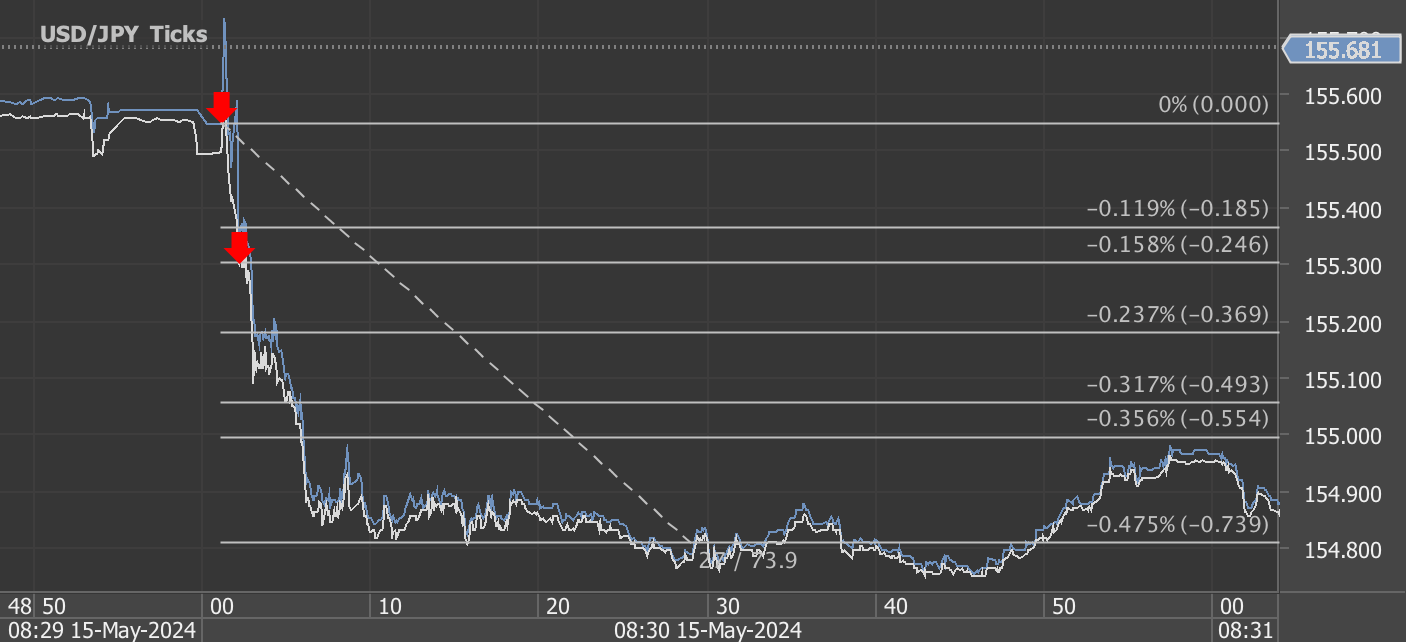
According to our analysis USDJPY and EURUSD moved 104 pips on US Retail Sales and US BLS Consumer Price Index (CPI) data on 15 May 2024.

USDJPY (73 pips)

EURUSD (31 pips)

Charts are exported from JForex (Dukascopy).


Understanding the Latest Economic Indicators: April 2024 CPI and U.S. Retail Sales

The U.S. Bureau of Labor Statistics and the Census Bureau have recently released critical economic data for April 2024, covering the Consumer Price Index (CPI) and retail sales figures. These releases provide a comprehensive snapshot of the current economic environment, highlighting consumer inflation and retail activity. Let's delve into the details of each report and discuss their broader implications.

Consumer Price Index for April 2024

The Consumer Price Index for All Urban Consumers (CPI-U) rose by 0.3 percent in April on a seasonally adjusted basis, following a 0.4 percent increase in March. Annually, the all items index increased by 3.4 percent before seasonal adjustment. Key takeaways include:

  • Shelter and Gasoline Indexes: These indexes significantly contributed to the monthly CPI rise, with the energy index increasing by 1.1 percent primarily due to these components.

  • Stable Food Prices: The food index remained unchanged, with a notable decrease in the food at home category, offset by increases in food away from home.

  • Less Volatile Core Inflation: Excluding food and energy, the core index also rose by 0.3 percent, indicating stable underlying inflation.

Over the past 12 months, the energy index increased by 2.6 percent, while the food index rose by 2.2 percent, highlighting specific areas where consumers may feel budget pressures.

U.S. Retail Sales in April 2024

The advance estimates of U.S. retail and food services sales for April 2024 were virtually unchanged from March, adjusted for seasonal variation, but showed a 3.0 percent increase from April 2023. Highlights from the report include:

  • Steady Sales Figures: Total sales from February to April 2024 were up 3.0 percent from the same period a year ago, indicating a consistent growth in consumer spending.

  • Strong Online Sales: Nonstore retailers recorded a robust 7.5 percent increase from the previous year, underscoring the ongoing shift towards online shopping.

  • Food Services Growth: Food services and drinking places saw a significant 5.5 percent increase year over year, possibly reflecting consumer confidence and increased social activities.

Implications and Outlook

These reports suggest a cautiously optimistic economic outlook. While inflation, as indicated by the CPI, remains present, its growth is steady rather than sharp, suggesting that inflationary pressures might be stabilizing. Meanwhile, the solid performance in retail sales, particularly in nonstore retailers and food services, points to healthy consumer spending, which is crucial for continued economic growth.

However, the stable yet significant inflation highlighted by the CPI could impact consumer purchasing power, especially if wage growth does not keep pace. This dynamic warrants close monitoring as it may influence future consumer spending and economic policy decisions.

As we look towards the future, these indicators will be vital for policymakers, businesses, and consumers alike to gauge the economic landscape and make informed decisions. The next release in June will provide further insights into whether these trends are holding steady or shifting, marking critical data points for economic forecasts and strategies.

Source: https://www.census.gov/retail/sales.html, https://www.bls.gov/news.release/cpi.nr0.htm


Please let us know your feedback. If you are interested in timestamps, please send us an email to sales@haawks.com.
Start futures forex fx news trading with Haawks G4A low latency machine-readable data today, one of the fastest news data feeds for US macro-economic and commodity data.

Comment

Comment

12 pips potential profit in 8 seconds on 14 May 2024, analysis on futures forex fx low latency news trading USDJPY and EURUSD on US BLS Producer Price Index (PPI) data

According to our analysis USDJPY and EURUSD moved 12 pips on US BLS Producer Price Index (PPI) data on 14 May 2024.

USDJPY (3 pips)

EURUSD (9 pips)

Charts are exported from JForex (Dukascopy).


Analyzing the April 2024 Producer Price Index (PPI) Increase: Key Takeaways and Economic Implications

The U.S. Bureau of Labor Statistics recently released the Producer Price Index (PPI) for April 2024, revealing a notable uptick of 0.5 percent on a seasonally adjusted basis. This increase comes after a slight decline of 0.1 percent in March and marks the largest rise since February's 0.6 percent gain. Over the past 12 months, the unadjusted index for final demand has risen by 2.2 percent, representing the most substantial annual increase since April 2023.

Breakdown of Key Components

1. Services Drive the Increase

Nearly three-quarters of April's rise can be attributed to the services sector, which saw a 0.6 percent increase, primarily driven by a significant 3.9 percent jump in portfolio management costs. Other contributing factors include higher prices in machinery and equipment wholesaling, residential real estate services, and truck transportation of freight.

2. Goods Also Up

Final demand goods increased by 0.4 percent, primarily due to a 5.4 percent rise in gasoline prices, which accounted for most of the increase. Despite this, there was a contrasting decline in food prices, notably a steep 18.7 percent drop in fresh and dry vegetables.

Deeper Insights: Excluding Volatile Sectors

When excluding foods, energy, and trade services, the index still shows a robust increase of 0.4 percent in April, following a 0.2 percent rise in March. This indicator is particularly telling as it excludes sectors that are typically volatile, providing a clearer picture of the underlying inflation trends. Year-over-year, this measure has seen a 3.1 percent increase, the largest since April 2023.

Implications for Economic Policy and Business Planning

The latest PPI data suggests underlying inflationary pressures in the economy, particularly in the services sector. Businesses, especially in sectors directly impacted by rising service costs, will need to adjust their pricing strategies and budgeting plans to accommodate these cost increases. Moreover, policymakers may need to consider these trends when designing monetary policy to ensure inflation targets are met without stifling economic growth.

Future Outlook

Given the PPI's role as a leading indicator of consumer price inflation, the April increase might signal upcoming changes in consumer prices, potentially affecting the Federal Reserve's decisions on interest rates. The economic landscape remains dynamic, and these price trends provide critical insights into the broader economic health.

As we look forward to the May 2024 PPI report scheduled for release on June 13, businesses and policymakers alike must stay vigilant and responsive to these evolving economic indicators.

This data not only helps in anticipating economic trends but also serves as a crucial tool for financial planning and analysis, ensuring stakeholders are well-prepared to navigate the complexities of an ever-changing economic environment.

Source: https://www.bls.gov/news.release/ppi.nr0.htm


Start futures forex fx news trading with Haawks G4A low latency machine-readable data, one of the fastest machine-readable news trading feed for US economic and commodity data.

Please let us know your feedback. If you are interested in timestamps, please send us an email to sales@haawks.com.

Comment

Comment

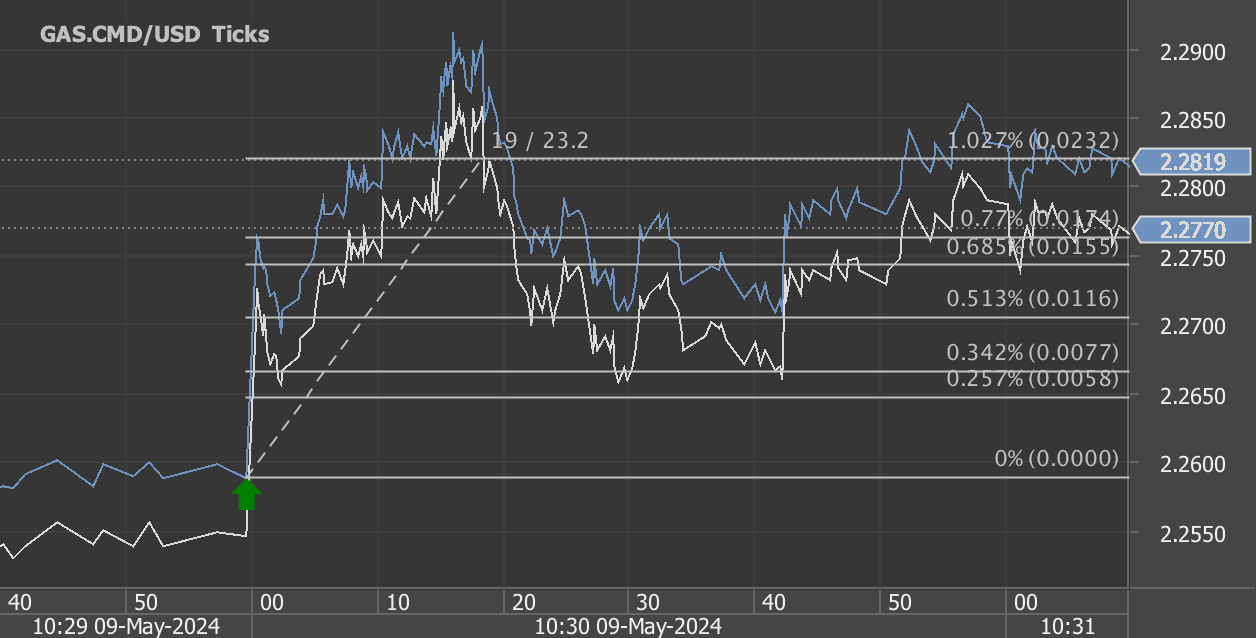
23 ticks potential profit in 19 seconds on 9 May 2024, analysis on futures forex fx news trading natural gas on DOE Natural Gas Storage Report data

According to our analysis natural gas moved 23 ticks on DOE Natural Gas Storage Report data on 9 May 2024.

Natural gas (23 ticks)

Charts are exported from JForex (Dukascopy).


U.S. Natural Gas Storage Update: Significant Stock Increases

As of May 3, 2024, the United States has seen a notable increase in its natural gas storage, according to the latest Weekly Natural Gas Storage Report released by the Energy Information Administration (EIA). The report, which provides an insightful snapshot into the nation's energy reserves, highlights a substantial storage volume of 2,563 billion cubic feet (Bcf). This represents a significant weekly increase of 79 Bcf, underscoring a robust addition to the nation's energy reserves.

Regional Breakdown and Historical Comparisons

The storage levels vary significantly across different regions:

  • East: The Eastern region now holds 454 Bcf, marking a substantial weekly increase of 29 Bcf. This volume is notably higher than the previous year's 419 Bcf and surpasses the five-year average of 351 Bcf by a remarkable 29.3%.

  • Midwest: This region shows a robust increase, with current stocks at 584 Bcf compared to 492 Bcf a year ago—an 18.7% increase. The figure also exceeds the five-year average by 37.7%.

  • Mountain: Here, the stocks stand at 191 Bcf, up from 101 Bcf last year, showcasing a dramatic year-over-year rise of 89.1%. The volume is also well above the five-year average by 85.4%.

  • Pacific: Stocks have reached 246 Bcf, up from last year’s 110 Bcf, marking a striking increase of 123.6% above the prior year and 35.2% over the five-year average.

  • South Central: Totaling 1,087 Bcf, this region's stocks have risen by 14 Bcf over the week, with a notable 9.2% increase over the previous year and a 26.1% rise above the five-year average.

Specifically, within the South Central region, the nonsalt facilities saw a noteworthy increase, reflecting a broader trend of robust inventory building across various storage types.

Implications for Energy Markets

The current levels of working gas in underground storage are substantially above both last year’s figures and the five-year average. This increased stock could suggest a more secure energy landscape in the U.S. for the short term, potentially stabilizing natural gas prices and offering some buffer against supply disruptions.

Moreover, the high storage levels are likely to play a crucial role in managing seasonal demand fluctuations, especially as the country approaches the high-demand summer months. Utilities and energy providers may find some relief in these figures, as ample storage typically translates into more manageable costs for end consumers.

Looking Ahead

With the next update scheduled for May 16, 2024, market participants and analysts will be keenly watching for signs of continued stock building or any adjustments in the flow dynamics. The detailed regional data will also help in assessing the local impacts on energy markets, crucial for local distributors and consumers alike.

In conclusion, the EIA’s latest report not only reflects a positive trend in natural gas availability but also underscores the resilience and strategic management of energy resources within the U.S. As stakeholders continue to navigate through the complexities of energy supply and demand, these storage figures provide a critical data point in the broader energy discourse.

Source: https://ir.eia.gov/ngs/ngs.html


Start futures forex fx commodity news trading with Haawks G4A low latency machine-readable data, one of the fastest data feeds for DOE data.

Please let us know your feedback. If you are interested in timestamps, please send us an email to sales@haawks.com.

Comment

Comment

77 pips potential profit in 97 seconds on 3 May 2024, analysis on forex fx futures news trading USDJPY and EURUSD on US Employment Situation (Non-farm payrolls/NFP) data

According to our analysis USDJPY and EURUSD moved around 77 pips on US Employment Situation (Non-farm payrolls / NFP) data on 3 May 2024.

USDJPY (51 pips)

EURUSD (26 pips)

Charts are exported from JForex (Dukascopy).


Analyzing the April 2024 Employment Situation Summary

The latest Employment Situation Summary released by the U.S. Bureau of Labor Statistics provides a mixed bag of insights into the state of the American job market as of April 2024. Total nonfarm payroll employment saw an increase of 175,000 jobs last month, which is notably lower than the average monthly gain of 242,000 over the previous year. This deceleration in job growth may signal a more cautious approach by businesses amidst various economic pressures. However, the unemployment rate remained stable at 3.9%, suggesting a still robust labor market.

Sector-Specific Highlights

Health Care: The health care sector continued to show strong performance with 56,000 new jobs added in April. This sector's resilience is critical as it aligns with ongoing demands in health services, especially in ambulatory health care services and hospitals.

Social Assistance: This sector also saw significant growth, adding 31,000 jobs, indicating ongoing needs in community and social services. The consistent job additions in social assistance reflect the growing societal emphasis on supportive services.

Transportation and Warehousing: With a 22,000 job increase, this sector shows a modest rebound, likely driven by the ongoing shifts in consumer delivery preferences and supply chain adjustments.

Retail Trade: Notably, the retail trade has picked up momentum with a 20,000 increase in jobs, led by gains in general merchandise and building material stores. This could be an indicator of consumer confidence and spending.

Challenges and Steady Sectors

Despite these positive trends, certain sectors like construction and government showed only slight changes in employment numbers. The construction sector's small gain of 9,000 jobs suggests a slowdown possibly linked to material costs or interest rate concerns. Government employment also showed minimal change, indicating a potential plateau in public sector hiring.

Economic Indicators and Wage Analysis

A key takeaway from the report is the slight increase in average hourly earnings, up 7 cents to $34.75, representing a 3.9% increase year-over-year. This gradual wage growth indicates ongoing adjustments to inflationary pressures but could also point to cautious employer spending in salary increments.

The average workweek slightly decreased by 0.1 hours to 34.3 hours, a subtle sign that businesses might be adjusting labor hours to manage costs or productivity demands.

Looking Ahead

As we move forward, the labor market appears to be balancing cautious employer behavior with steady consumer activity. The sectors showing growth highlight areas of economic strength, while the overall slowdown in job additions could suggest a market awaiting clearer economic signals.

For policymakers and business leaders, these insights provide a nuanced perspective on workforce dynamics as they plan for potential economic shifts. For workers, the steady yet selective growth in sectors may influence decisions on skill development and job opportunities.

As we look to the next Employment Situation Summary due in June, all eyes will be on whether these trends hold steady or if new economic factors will emerge, influencing job market trajectories in mid-2024.

Source: https://www.bls.gov/news.release/empsit.nr0.htm


Start forex fx futures news trading with Haawks G4A low latency machine-readable data today, one of the fastest news data feeds for US economic and commodity data.

Please let us know your feedback. If you are interested in timestamps, please send us an email to sales@haawks.com.

Comment

384 pips potential forex fx futures news trading profit from 12 events in April 2024 with Haawks G4A machine-readable data feed

Comment

384 pips potential forex fx futures news trading profit from 12 events in April 2024 with Haawks G4A machine-readable data feed

According to our analysis there was a potential of 384 pips / ticks profit out of the following 12 events in April 2024. The potential performance in 2023 was 13,607 pips / ticks.

April 2024

Cumulative potential, indicative performance April 2024, please see all releases below.

Total trading time would have been around 12 minutes! (preparation time not included)


Economic Reports: A Snapshot of April 2024's Influence on Financial Markets

April 2024 was a bustling month for financial markets, with numerous key economic reports released globally that influenced trading behaviors and investor sentiment. In this post, we'll delve into some of the most significant reports and their impact on market fluctuations, measured in ticks and pips.

Natural Gas Storage and Petroleum Status in the US

The Department of Energy's (DOE) Natural Gas Storage Reports from April 4 and April 11 showed fluctuations of 10 and 21 ticks, respectively. These reports often influence natural gas prices which in turn impact energy stocks and ETFs. On a related note, the DOE Petroleum Status Report on April 10 also sparked a movement of 38 ticks, reflecting changes in crude oil inventories that typically sway energy markets significantly.

Canadian and Swedish Labour Markets

The Labour Force Surveys from Canada and Sweden, released on April 5 and April 24 respectively, revealed interesting labor market dynamics. Canada's report moved the market by 46 pips, while Sweden's had a more pronounced effect with a 67 pip movement. These movements highlight the sensitivity of currency markets to employment trends, as they often signal economic health and influence central bank policies.

US Economic Health through CPI and PPI

The US Bureau of Labor Statistics (BLS) released its Consumer Price Index (CPI) and Producer Price Index (PPI) on April 10 and April 11, leading to movements of 57 and 35 pips, respectively. The CPI is a primary gauge of inflation, while the PPI provides insight into the inflationary pressures at the producer level. Both are crucial indicators for the Federal Reserve's monetary policy decisions, affecting the dollar's strength and bond yields.

Retail Sales and Manufacturing Insights

US Retail Sales on April 15 saw a movement of 39 pips, reflecting consumer spending health, a key component of economic growth. The Philadelphia Federal Reserve Bank's Manufacturing Business Outlook Survey, moving by 20 pips on April 18, provided insights into the manufacturing sector's conditions, influencing equities in related sectors.

Gross Domestic Product Reports

The US and Canada released their GDP reports on April 25 and April 30, with market movements of 18 and 20 pips, respectively. GDP reports are pivotal as they summarize overall economic activity and health, influencing a wide array of investment decisions and policy considerations.

Conclusion

Each report in April 2024 painted part of a larger economic picture, influencing market dynamics in various sectors. For traders and investors, understanding these reports and their impacts is crucial for making informed decisions. As we look ahead, it will be interesting to see how these trends develop and what new data will shape the financial landscape.

Disclaimer: This blog post is for informational purposes only and should not be construed as financial advice. Always conduct thorough research and consider seeking advice from a financial professional before making any investment decisions.


Start futures/forex/oil/grains news trading with Haawks G4A low latency machine-readable data today, we offer one of the fastest machine-readable data feeds for US macro-economic and commodity data and macro-economic data from Norway, Sweden, Turkey Switzerland and ECB interest rates and statement.

Please let us know your feedback and check out our G4A low latency data feed.

All data is machine readable and available via API access in Aurora, CH1, NY4 and LD4. Free trials.

Comment

Comment

20 pips potential profit in 61 seconds on 30 April 2024, analysis on futures forex fx news trading USDCAD on Canada GDP data

According to our analysis USDCAD moved 20 pips on Canada Gross Domestic Product (GDP) data on 30 April 2024.

USDCAD (20 pips)

Charts are exported from JForex (Dukascopy).


Analyzing the Nuances of Canada's GDP Growth in February 2024

In February 2024, Canada's real Gross Domestic Product (GDP) witnessed a modest increase of 0.2%, maintaining a stable yet slower growth compared to the 0.5% rise observed in January. This growth was primarily driven by the services-producing industries, with notable performances in transportation and warehousing sectors.

Sectoral Highlights of February's GDP Growth

Transportation and Warehousing Take the Lead

The transportation and warehousing sector showcased a significant growth of 1.4%, marking the largest monthly growth rate since January 2023. A notable rebound in rail transportation, which surged by 5.5%, played a critical role in this expansion. The uplift in rail activities came as operations normalized following the harsh weather conditions in Western Canada earlier in the year. Additionally, air transportation also saw a substantial increase of 4.8%, fueled by a rise in international travel, particularly to Asia around the Lunar New Year.

Utilities and Manufacturing Face Downturns

Contrasting the gains in transportation and warehousing, the utilities sector experienced a decline of 2.6%. This downturn is partly attributed to a decrease in demand for heating following a particularly cold January. Similarly, the manufacturing sector faced challenges, declining by 0.4%, with significant setbacks in transportation equipment manufacturing due to ongoing retooling shutdowns.

Mining and Oil & Gas Sectors Bounce Back

The mining, quarrying, and oil and gas extraction sector witnessed a growth of 2.5%, effectively recuperating from a 2.3% drop in January. This recovery was led by a 3.3% increase in oil and gas extraction, excluding oil sands, which saw growth across various production types. This sector's rebound underscores its volatile nature and susceptibility to external conditions, such as weather impacts on operational capabilities.

Public Sector and Financial Services Show Steady Growth

The public sector continued to grow, although at a slower pace of 0.2%, with educational services and healthcare contributing modestly. Meanwhile, the finance and insurance sector recorded a 0.3% increase, marking its third consecutive month of growth, driven by robust activities in financial investment services.

Looking Forward: Preliminary Estimates for March 2024

Preliminary data for March 2024 suggests that the real GDP remained largely unchanged, with gains in utilities and real estate being offset by declines in manufacturing and retail trade. This points to a mixed economic landscape where certain sectors are expanding while others retract, reflecting the complex interplay of domestic and global economic factors.

Conclusion

As we await the official first-quarter GDP figures due for release on May 31, 2024, it's clear that Canada's economy is experiencing a period of cautious optimism mixed with sector-specific challenges. The ongoing fluctuations across different industries highlight the need for businesses and policymakers to remain adaptable and responsive to changing economic conditions. This nuanced picture of Canada's economic health offers valuable insights into the resilience and vulnerabilities within its diverse sectors.

Source: https://www150.statcan.gc.ca/n1/daily-quotidien/240430/dq240430a-eng.htm


Start futures forex fx news trading with Haawks G4A low latency machine-readable data today, one of the fastest news data feeds for US macro-economic and commodity data.

Please let us know your feedback. If you are interested in timestamps, please send us an email to sales@haawks.com.
Comment

Comment

18 pips potential profit in 8 seconds on 25 April 2024, analysis on futures forex fx low latency news trading USDJPY and EURUSD on US Gross Domestic Product (GDP)

According to our analysis USDJPY and EURUSD moved 18 pips on US Gross Domestic Product (GDP) data on 25 April 2024.

USDJPY (10 pips)

EURUSD (8 pips)

Charts are exported from JForex (Dukascopy).


Understanding the First Quarter GDP Growth of 2024

The U.S. economy started 2024 with a more moderate growth pace, as the Bureau of Economic Analysis (BEA) released its advance estimate showing a 1.6% annual growth rate in real Gross Domestic Product (GDP) for the first quarter. This figure marks a slowdown from the 3.4% growth recorded in the fourth quarter of 2023, hinting at a mixed economic landscape as the year unfolds.

Key Drivers of Growth

The modest growth in GDP this quarter was primarily driven by increased consumer spending, especially on services like healthcare and financial services. This was supplemented by gains in residential fixed investment and nonresidential fixed investment, as well as heightened activity in state and local government spending. However, these positive contributions were somewhat offset by a decline in private inventory investment and an increase in imports, which act as a subtraction in the calculation of GDP.

Among the standout sectors, the report highlighted a notable increase in intellectual property products and a surge in compensation for state and local government employees. On the downside, the automotive and energy sectors experienced declines, pulling the goods segment down despite the broader gains in services.

Economic Deceleration Points

The deceleration in GDP growth from the previous quarter can be attributed to slower consumer spending, a dip in federal government spending, and a decrease in exports. Although residential fixed investment showed acceleration, it wasn't enough to fully counterbalance the slowdowns elsewhere.

Inflation and Income Trends

Inflation indicators from the first quarter reveal a continued pressure on prices, with the price index for gross domestic purchases rising to 3.1% from 1.9% in the prior quarter. Similarly, the Personal Consumption Expenditures (PCE) price index climbed to 3.4%, up from 1.8%. These figures suggest an uptick in inflationary pressures, potentially influencing future monetary policy decisions.

On the income front, current-dollar personal income saw a substantial increase of $407.1 billion, a significant rise compared to the $230.2 billion increase in the previous quarter. This boost in personal income was largely fueled by rises in compensation and personal current transfer receipts. However, the personal saving rate dipped to 3.6% from 4.0%, indicating that despite higher incomes, savings were lower—perhaps a reflection of increased consumer confidence or rising costs.

Looking Ahead

While the first quarter GDP report shows growth, the mix of accelerating and decelerating factors across different sectors paints a complex picture of the U.S. economy. The forthcoming "second" GDP estimate due on May 30, 2024, will provide a clearer view as it will include more complete data.

Investors, policymakers, and analysts will be watching closely to see if these trends hold, particularly with regard to inflation and how it might shape responses from the Federal Reserve. Meanwhile, individuals will feel the impact of these economic shifts in their daily lives, from employment prospects to purchasing power.

In summary, the first quarter of 2024 has set the stage for a year that could be marked by careful balancing acts in economic policy and personal finance management, amidst a landscape of gradual growth and shifting investment dynamics.

Source: https://www.bea.gov/news/2024/gross-domestic-product-first-quarter-2024-advance-estimate


Start futures forex fx news trading with Haawks G4A low latency machine-readable data, one of the fastest machine-readable news trading feeds for macro-economic and commodity data from the US and Europe.

Please let us know your feedback. If you are interested in timestamps, please send us an email to sales@haawks.com.

Comment

Comment

13 pips potential profit in 90 seconds on 24 April 2024, analysis on futures forex fx news trading USDCAD on Canada Retail Sales data

According to our analysis USDCAD moved 13 pips on Canada Retail Sales data on 24 April 2024.

USDCAD (13 pips)

Charts are exported from JForex (Dukascopy).


Canadian Retail Sales Slightly Dip in February 2024

In February 2024, Canadian retail sales experienced a marginal decline, edging down 0.1% to $66.7 billion. This subtle decrease reflects a challenging month for several key subsectors, according to the latest data from Statistics Canada.

Subsector Performance

The decrease in retail sales was primarily led by a 2.2% drop at gasoline stations and fuel vendors. This sector also saw a significant reduction in volume terms, with sales decreasing by 3.9%. Despite the overall dip, not all areas experienced declines. The motor vehicle and parts dealers subsector, for example, saw an increase of 0.5%. Within this group, other motor vehicle dealers reported a robust growth of 5.1%, with new car dealers also up by 0.3%.

Core Retail Sales Hold Steady

Interestingly, when excluding gasoline stations and fuel vendors as well as motor vehicle and parts dealers, core retail sales remained unchanged from January. This stability is noteworthy, considering the fluctuations seen in specific subsectors. General merchandise retailers reported a rise of 1.1%, while health and personal care stores saw a smaller increase of 0.4%.

However, these gains were offset by decreases in other areas, including a 1.5% fall in sales at furniture, home furnishings, electronics, and appliance retailers. Clothing and related products retailers also faced challenges, with sales decreasing by 1.0%.

Regional Insights

Provincially, sales trends varied. Alberta witnessed the largest decline with a 1.1% decrease, primarily driven by lower sales at motor vehicle and parts dealers. In contrast, British Columbia recorded the largest increase, with sales rising by 1.2%, led by the same subsector.

In Ontario, a modest decrease of 0.2% was observed, with lower sales at gasoline stations and fuel vendors contributing to this trend. The Toronto metropolitan area experienced a more pronounced decrease of 2.3%.

E-commerce Continues to Grow

Retail e-commerce sales presented a brighter spot in February's retail landscape. On a seasonally adjusted basis, e-commerce sales climbed 1.9% to $3.8 billion, now representing 5.7% of total retail trade. This marks a slight increase from the 5.6% share observed in January, suggesting a continued shift towards online shopping among Canadian consumers.

Looking Ahead

Providing a glimpse into the future, Statistics Canada's advance retail indicator suggests that retail sales remained stable in March. This estimate, based on responses from 61.9% of companies surveyed, will be revised as more data becomes available. However, it offers a preliminary sign that the retail sector might be steadying after a fluctuating start to the year.

In conclusion, while the overall decrease in retail sales for February was slight, the varied performance across different sectors and regions highlights the ongoing challenges and opportunities within the Canadian retail landscape. As businesses continue to adapt to shifting consumer preferences and economic conditions, the coming months will be critical in shaping the trajectory of the retail sector in 2024.

Source: https://www150.statcan.gc.ca/n1/daily-quotidien/240424/dq240424a-eng.htm


Start futures forex fx news trading with Haawks G4A low latency machine-readable data today, one of the fastest news data feeds for US macro-economic and commodity data.

Please let us know your feedback. If you are interested in timestamps, please send us an email to sales@haawks.com.

Comment

Comment

67 pips potential profit in 89 seconds on 24 April 2024, analysis on futures forex fx news trading EURSEK first on Sweden Labour Force (LFS) data

According to our analysis EURSEK moved 67 pips on Sweden Labour Force Survey (LFS) data on 24 April 2024.

EURSEK (67 pips)

Charts are exported from JForex (Dukascopy).


Unpacking the March 2024 Labour Force Survey: A Detailed Analysis of Sweden's Employment Landscape

In March 2024, Sweden's labour market faced some challenging shifts, as indicated by the latest data from Statistics Sweden. The figures paint a nuanced picture of the employment sector, marked notably by an increase in unemployment rates, particularly among women and young people. Here, we delve into the key insights from the March 2024 Labour Force Surveys (LFS) to understand the implications and trends shaping Sweden's workforce.

Rising Unemployment Rates

The latest data reveals a concerning uptick in the number of unemployed people, increasing by 86,000 to a total of 525,000. This jump has pushed the unemployment rate to 9.2%, a significant rise of 1.5 percentage points. Notably, the impact has been more pronounced among specific demographics, including women and the youth, where unemployment rates have surged even higher. The figures reflect broader economic pressures and potential shifts in industry demands.

Employment and Labour Force Participation

Despite the rise in unemployment, the total number of people employed stands at 5,188,000. However, when dissected further, the data shows disparities in employment rates between genders. Men have a higher employment rate of 70.8%, compared to 65.8% for women. The overall labour force participation has seen a slight improvement, with a 0.1 percentage point increase to 75.4%, suggesting a larger number of individuals are either employed or actively seeking work.

Trends in Permanent and Temporary Employment

The composition of the workforce has also seen shifts, particularly in the types of employment people are engaging in. There has been a noticeable decrease in temporary employment, dropping by 74,000 from the previous year, which could indicate a move towards more stable employment conditions or perhaps a cut in temporary job offerings. The number of permanent employees slightly increased, suggesting a potential stabilization in job security for many.

Youth Unemployment: A Growing Concern

One of the more alarming trends from the report is the sharp increase in youth unemployment. The rate for individuals aged 15-24 has escalated to 29.6%, an increase of 5.0 percentage points. This spike could be indicative of difficulties facing young entrants into the job market, possibly driven by a lack of suitable job opportunities or the competitive nature of entry-level positions.

Unused Labour Supply

Another critical aspect highlighted in the report is the unused labour supply, which averaged 24.6 million hours per week. This figure represents potential productivity that is not being utilized in the economy, equivalent to 615,000 full-time positions. This underutilization could suggest mismatches in the job market where the skills of the labour force are not aligning with the demands of available jobs.

Looking Ahead

The March 2024 LFS data gives us important insights into the current state and challenges of the Swedish labour market. It's evident that certain groups are facing more significant hurdles, with increases in unemployment rates particularly impacting women and young people. As we look to the future, these trends highlight the need for targeted policy interventions and support programs to help those most affected and to bridge the gap in unused labour potential.

For policymakers, understanding these dynamics is crucial to devising effective strategies to foster a more resilient and inclusive job market. For businesses, the shifting landscape presents both challenges in workforce planning and opportunities to innovate in how they recruit, train, and retain talent.

As we continue to navigate these turbulent times, staying informed and adaptive will be key to overcoming the challenges presented by the evolving employment landscape in Sweden.

Source: https://www.scb.se/en/finding-statistics/statistics-by-subject-area/labour-market/labour-force-surveys/labour-force-surveys-lfs/pong/statistical-news/labour-force-surveys-lfs-march-2024/


Start futures forex fx news trading with Haawks G4A low latency machine-readable data today, one of the fastest news data feed for macro-economic and commodity data from the US and Europe.

Please let us know your feedback. If you are interested in timestamps, please send us an email to sales@haawks.com.

Comment