Comment

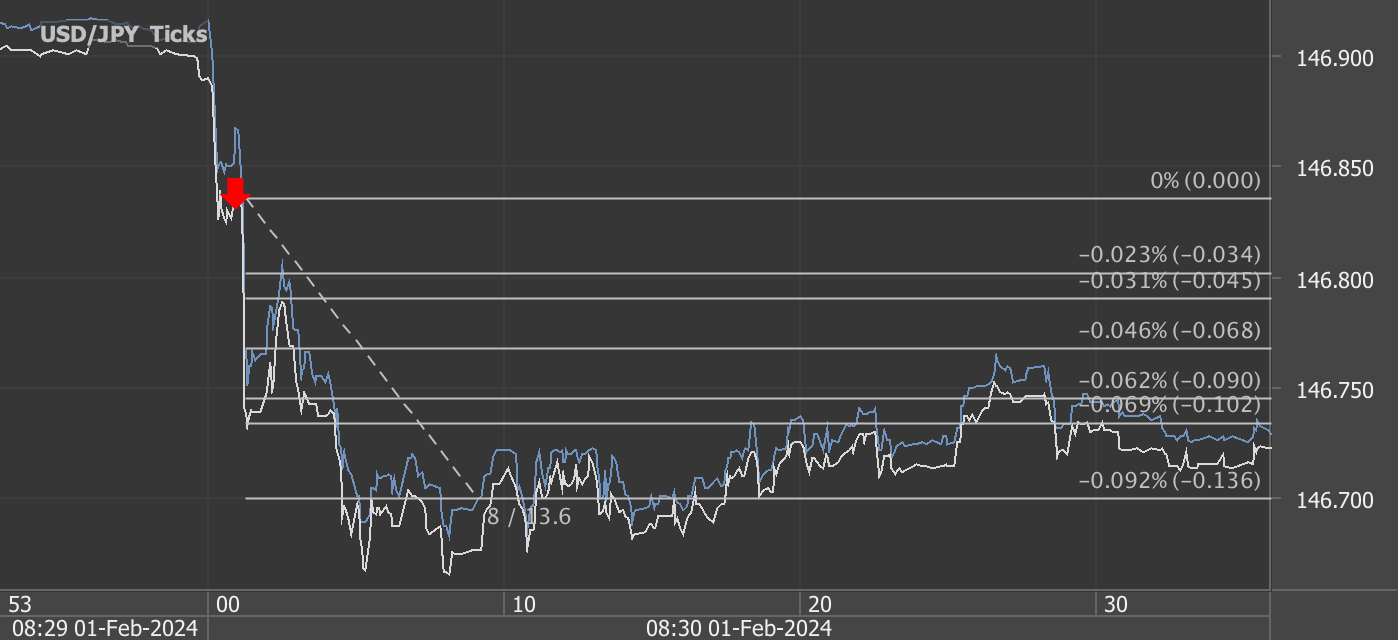
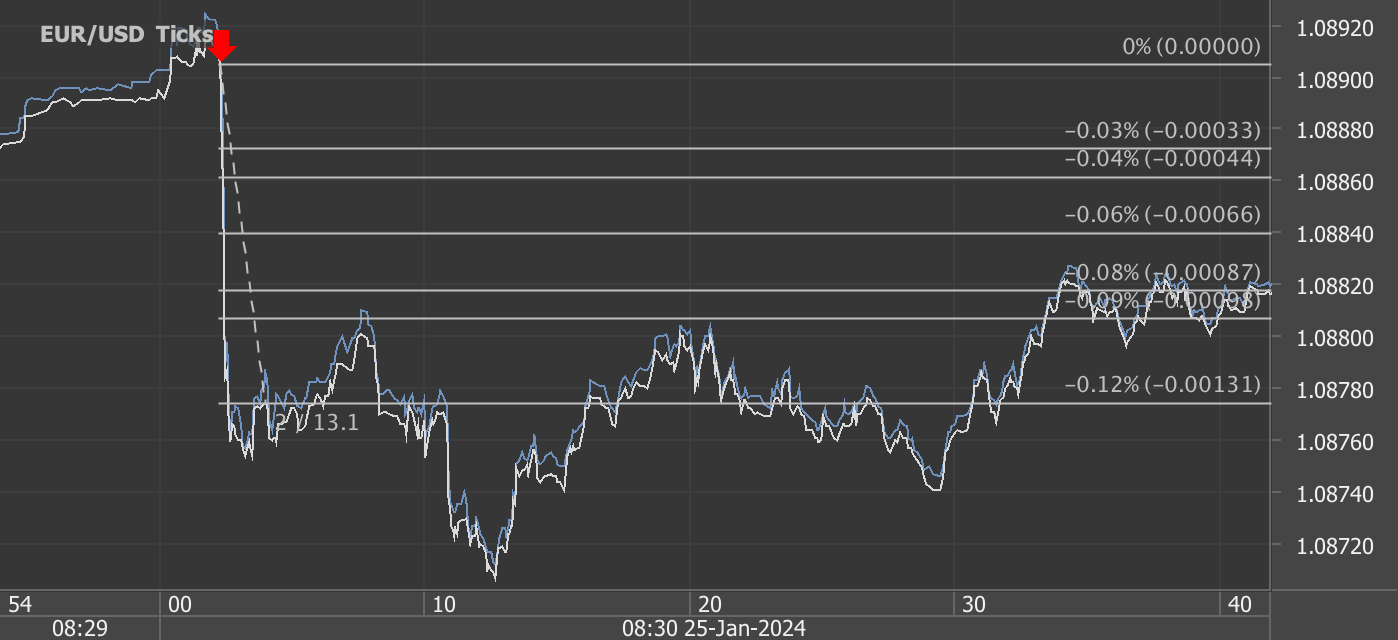
35 pips potential profit in 25 seconds on 15 February 2024, analysis on futures forex fx news trading USDJPY and EURUSD on US Philly Fed Manufacturing and US Retail Sales data

According to our analysis USDJPY and EURUSD moved 35 pips on US Philadelphia Federal Reserve Bank Manufacturing Business Outlook Survey data and US Retail Sales data on 15 February 2024.

USDJPY (21 pips)

EURUSD (14 pips)

Charts are exported from JForex (Dukascopy).


Analyzing the Latest Economic Indicators: Retail Sales and Manufacturing Sector Insights

In the ever-evolving landscape of the U.S. economy, recent releases from the Commerce Department and the Federal Reserve Bank offer critical insights into consumer behavior and manufacturing activity. The Advance Monthly Sales for Retail and Food Services report and the February 2024 Manufacturing Business Outlook Survey provide a mixed picture of the current economic environment, with signs of resilience in certain sectors despite overarching challenges. Let's delve into the details of both releases to understand their implications.

Retail Sales Take a Slight Dip with a Silver Lining

According to the Commerce Department's report for January 2024, U.S. retail and food services sales saw a minor retreat, marking a 0.8 percent decrease from the previous month, yet they experienced a 0.6 percent increase from January 2023. This nuanced performance underscores a broader trend of cautious consumer spending amidst economic uncertainties. Total sales for the November 2023 through January 2024 period, however, were up 3.1 percent from the same period a year ago, indicating a sustained appetite for retail and food services over the longer term.

The report also highlighted significant sectoral disparities. While traditional retail trade sales dipped slightly, nonstore retailers and food services continued to exhibit strong growth, suggesting a shift in consumer preferences towards online shopping and dining out. This divergence reflects the dynamic nature of consumer spending patterns and the ongoing adaptation of the retail sector to changing tastes and technological advancements.

Manufacturing Sector Shows Signs of Cautious Optimism

The Federal Reserve Bank's February 2024 Manufacturing Business Outlook Survey presents a cautiously optimistic view of the manufacturing sector. After months of subdued activity, the survey's indicators for general activity and shipments turned positive, signaling a potential rebound. However, the new orders index, despite improvements, remained in negative territory, indicating persistent challenges in demand.

Employment in the manufacturing sector appears to be contracting, with the employment index dropping to its lowest reading since May 2020. This suggests that manufacturers are becoming more cautious in their hiring, possibly due to uncertainties about future demand and operational costs.

Price indexes, while indicating overall increases, remain below long-run averages, hinting at a complex pricing environment where firms are possibly facing pressures to manage costs amidst fluctuating demand.

Looking ahead, the survey's future activity indicators suggest that manufacturers are growing more optimistic about growth over the next six months. This optimism is reflected in the expectations for increased activity, new orders, and even capital expenditures, pointing towards a cautious but hopeful outlook for the manufacturing sector.

Conclusion

The contrasting narratives from the retail and manufacturing sectors highlight the multifaceted nature of the current economic landscape. On one hand, consumer spending in the retail sector shows resilience, with significant growth in online shopping and food services. On the other hand, the manufacturing sector, while facing immediate challenges, is cautiously optimistic about the future.

These developments suggest that while the economy navigates through uncertainties, certain sectors continue to adapt and find growth opportunities. For businesses and policymakers, understanding these nuanced dynamics is crucial for making informed decisions and fostering a supportive environment for growth and stability in the changing economic climate.

Source: https://www.census.gov/retail/sales.html, https://www.philadelphiafed.org/surveys-and-data/regional-economic-analysis/mbos-2024-02


Please let us know your feedback. If you are interested in timestamps, please send us an email to sales@haawks.com.

Start futures forex fx news trading with Haawks G4A low latency machine-readable data today, one of the fastest news data feeds for US macro-economic and commodity data.

Comment

Comment

24 pips potential profit in 3 minutes on 8 February 2024, analysis on futures forex fx low latency news trading USDJPY and EURUSD on US Jobless Claims data

According to our analysis USDJPY and EURUSD moved 24 pips on US Jobless Claims data on 8 February 2024.

USDJPY (19 pips)

EURUSD (5 pips)

Charts are exported from JForex (Dukascopy).


The latest report on unemployment insurance weekly claims, released on February 8, 2024, indicates a decrease in the number of initial jobless claims and a slight improvement in the U.S. labor market conditions. For the week ending February 3, the seasonally adjusted initial claims fell by 9,000 to 218,000 from the previous week's revised level. The 4-week moving average, which smooths out weekly volatility, increased slightly to 212,250. The seasonally adjusted insured unemployment rate decreased to 1.2% for the week ending January 27, with a corresponding decline in the number of people receiving unemployment benefits to 1,871,000.

Unadjusted data also showed a decline in initial claims, totaling 232,727, which is an 11.8% decrease from the previous week. The unadjusted insured unemployment rate stood at 1.4%, with a year-over-year comparison indicating a stable labor market. Regionally, the highest unemployment rates were in New Jersey, Rhode Island, and Minnesota, among others, with notable increases in initial claims in Oregon, California, and New York, and significant decreases in Illinois, Missouri, and Massachusetts.

This report suggests a resilient labor market, with fluctuations in unemployment claims reflecting normal economic adjustments rather than a significant downturn.

Source: https://www.dol.gov/ui/data.pdf


Start futures forex fx news trading with Haawks G4A low latency machine-readable data, one of the fastest machine-readable news trading feeds for US economic and commodity data.

Please let us know your feedback. If you are interested in timestamps, please send us an email to sales@haawks.com.

Comment

3879 pips potential futures forex fx news trading profit from 31 events in the fourth quarter of 2023 with Haawks G4A machine-readable news data feed

Comment

3879 pips potential futures forex fx news trading profit from 31 events in the fourth quarter of 2023 with Haawks G4A machine-readable news data feed

We are pleased to announce that there was a potential of 3879 pips/ticks profit out of the following 31 events in the fourth quarter of 2023 based on our ex-post analysis. The potential performance for 2023 was 13,607 pips/ticks.

Q4 2023

Cumulative potential, indicative performance Q4 2023, please see all releases below.

Total trading time would have been around 47 minutes in 3 months! (preparation time not included)


Navigating the Waves of Market Volatility: Insights from Recent Economic Data

In the ever-evolving landscape of financial markets, understanding the nuances of economic reports and central bank decisions is akin to mastering the art of navigation in the high seas of global finance. The recent flurry of economic data and policy announcements offers a treasure trove of insights for both seasoned investors and market novices alike. This blog post delves into the significant economic events from late 2023, analyzing their impact on various financial markets and what they portend for future market dynamics.

Unraveling the Tapestry of Economic Indicators

Economic reports such as the US Employment Situation (Non-farm payrolls/NFP), Consumer Price Index (CPI), and Gross Domestic Product (GDP) are pivotal in shaping market sentiment and monetary policy. Similarly, decisions by central banks, including the Federal Open Market Committee (FOMC) and other international bodies, play a crucial role in determining the cost of borrowing money, which in turn influences economic growth and inflation.

The Ripple Effects of US Economic Reports

The US economy, being the largest in the world, has a profound impact on global markets. For instance, the Non-farm Payrolls report for early November showed a significant movement, with a change of 58 pips & 83 points, underscoring the labor market's resilience or concerns, depending on the data's context. Such fluctuations often lead to volatility in the forex, bond, and stock markets as investors adjust their portfolios in response to the health of the US economy.

The Consumer Price Index (CPI), a key measure of inflation, saw movements of 11 pips in mid-October and a notable 58 pips & 222 points in mid-November. These shifts highlight market reactions to inflationary pressures, influencing the Federal Reserve's interest rate decisions.

Global Perspectives: From Sweden to Turkey

The economic reports are not limited to the US. International data, such as Sweden's CPI and Turkey's interest rate decision, also sway market sentiments. Sweden's CPI movement of 154 pips in mid-October indicates significant inflationary trends or deflationary pressures, affecting the Swedish Krona and potentially influencing the European Central Bank's (ECB) monetary policy.

Turkey's dramatic interest rate decision movement of 1668 pips in late November reflects the country's economic policy stance and its implications for currency volatility, inflation, and international trade relations.

Central Bank Decisions: A Balancing Act

Central bank decisions, such as those made by the FOMC and Norges Bank, are critical. For instance, the FOMC's interest rate decision and projections in mid-December led to a 67 pips & 104 points movement, illustrating the market's sensitivity to US monetary policy. Such decisions impact global borrowing costs, investment flows, and currency values.

Forward-Looking Strategies

Given the intricate dance of economic indicators and central bank policies, investors and traders must adopt forward-looking strategies to navigate market volatility. Staying informed about upcoming reports, understanding the historical context of data releases, and diversifying portfolios can mitigate risks and capitalize on opportunities.

The Importance of Diversification

Diversification across asset classes, sectors, and geographies is a time-tested strategy to spread risk. The variability in market reactions to different reports underscores the unpredictability of financial markets and the need for a well-rounded investment approach.

Staying Informed and Agile

In a world where information is king, staying abreast of economic calendars and market analyses is paramount. Agile investors can adjust their strategies in response to new data, seizing opportunities or hedging against potential downturns.

Conclusion

The latter part of 2023 has been a vivid reminder of the dynamic nature of financial markets, driven by a complex web of economic reports and central bank decisions. By dissecting these events and understanding their implications, investors and traders can better navigate the uncertain waters of global finance, making informed decisions that align with their investment goals and risk tolerance. As we look ahead, the ability to interpret economic indicators and anticipate policy shifts will remain indispensable tools in the investor's toolkit.

Disclaimer: This blog post is for informational purposes only and should not be construed as financial advice. Always conduct thorough research and consider seeking advice from a financial professional before making any investment decisions.


Start futures/forex/oil/grains news trading with Haawks G4A low latency machine-readable data today, we offer one of the fastest machine-readable data feeds for US economic and commodity data and economic data from Norway, Sweden, Turkey and ECB interest rates and statement.

Please let us know your feedback and check out our G4A low latency data feed.

All data is machine readable and available via API access in Aurora, CH1, NY4 and LD4. Free trials.

Comment

Comment

95 pips potential profit in 89 seconds on 2 February 2024, analysis on forex fx futures news trading USDJPY and EURUSD on US Employment Situation (Non-farm payrolls/NFP) data

According to our analysis USDJPY and EURUSD moved around 95 pips on US Employment Situation (Non-farm payrolls / NFP) data on 2 February 2024.

USDJPY (55 pips)

EURUSD (40 pips)

Charts are exported from JForex (Dukascopy).


The U.S. Bureau of Labor Statistics released the Employment Situation Summary for January 2024, showing significant job growth and stable unemployment rates. Here are the key points:

  • Total Nonfarm Payroll Employment Increase: In January, there was an increase of 353,000 jobs, with the unemployment rate holding steady at 3.7 percent. This continues the trend of job growth across various sectors, notably in professional and business services, health care, retail trade, and social assistance. However, there was a decline in employment within the mining, quarrying, and oil and gas extraction industry.

  • Household Survey Data: The unemployment rate remained constant at 3.7 percent for the third consecutive month, with the number of unemployed individuals slightly changing to 6.1 million. Unemployment rates among major worker groups, including adult men, women, teenagers, Whites, Blacks, Asians, and Hispanics, showed minimal or no change in January. Long-term unemployment (jobless for 27 weeks or more) also remained stable, accounting for 20.8 percent of the unemployed.

  • Labor Force Participation: The labor force participation rate was unchanged at 62.5 percent, and the employment-population ratio slightly varied at 60.2 percent, indicating little to no change over the year. Additionally, 4.4 million individuals were employed part-time for economic reasons, with the number of people not in the labor force but wanting a job remaining at 5.8 million.

  • Establishment Survey Data: Job gains were observed in several sectors, with professional and business services adding 74,000 jobs, health care employment rising by 70,000, and retail trade employment increasing by 45,000. However, the mining, quarrying, and oil and gas extraction industry saw a decrease in employment by 5,000.

  • Earnings and Workweek: Average hourly earnings for all employees on private nonfarm payrolls rose by 19 cents to $34.55, marking a 4.5 percent increase over the past 12 months. The average workweek for all employees decreased by 0.2 hour to 34.1 hours in January.

  • Revisions: The employment figures for November and December were revised, showing that employment was 126,000 higher than previously reported. The next Employment Situation release is scheduled for March 8, 2024.

This report reflects a robust job market, with significant employment gains in various sectors and stable unemployment rates, contributing to the overall health of the U.S. economy.

Source: https://www.bls.gov/news.release/empsit.nr0.htm


Start forex fx futures news trading with Haawks G4A low latency machine-readable data today, one of the fastest news data feeds for US economic and commodity data.

Please let us know your feedback. If you are interested in timestamps, please send us an email to sales@haawks.com.

Comment

Comment

17 pips potential profit in 8 seconds on 1 February 2024, analysis on futures forex fx low latency news trading USDJPY and EURUSD on US Jobless Claims data

According to our analysis USDJPY and EURUSD moved 17 pips on US Jobless Claims data on 1 February 2024.

USDJPY (13 pips)

EURUSD (4 pips)

Charts are exported from JForex (Dukascopy).


The latest unemployment insurance weekly claims report provides detailed statistics on initial and continued claims for unemployment benefits in the United States for the week ending January 27, 2024. Here's a summary of the key points:

Seasonally Adjusted Data

  • Initial Claims: The seasonally adjusted initial claims for the week ending January 27 were 224,000, marking an increase of 9,000 from the previous week's revised level of 215,000.

  • 4-Week Moving Average: The moving average of initial claims rose by 5,250 to 207,750.

  • Insured Unemployment Rate: For the week ending January 20, the insured unemployment rate increased slightly to 1.3 percent, up by 0.1 percentage points.

  • Insured Unemployment Numbers: Seasonally adjusted insured unemployment during the week ending January 20 was 1,898,000, up by 70,000 from the previous week's revised level.

Unadjusted Data

  • Initial Unadjusted Claims: The advance number of unadjusted initial claims was 261,029 for the week ending January 27, an increase of 11,082 (or 4.4 percent) from the previous week.

  • Unadjusted Insured Unemployment Rate: The unadjusted insured unemployment rate was 1.5 percent during the week ending January 20, up by 0.1 percentage point.

  • Unadjusted Insured Unemployment Levels: There were 2,187,036 individuals claiming unemployment insurance in state programs, an increase of 133,750 (or 6.5 percent) from the previous week.

Additional Insights

  • Total Continued Weeks Claimed: For the week ending January 13, there were 2,080,990 continued weeks claimed in all programs, a decrease from the previous week.

  • Initial Claims by Federal Employees and Veterans: There was a decrease in initial claims filed by former Federal civilian employees and newly discharged veterans.

  • States with the Highest Insured Unemployment Rates: New Jersey and Rhode Island had the highest insured unemployment rates at 2.6 percent.

  • States with Notable Changes in Initial Claims: Wisconsin and Washington saw the largest increases in initial claims, while Texas, California, New York, Georgia, and Oregon experienced significant decreases.

This report indicates fluctuations in the job market, with an overall increase in both initial and continued claims for unemployment benefits, suggesting changes in the employment landscape.

Source: https://www.dol.gov/ui/data.pdf


Start futures forex fx news trading with Haawks G4A low latency machine-readable data, one of the fastest machine-readable news trading feeds for US economic and commodity data.

Please let us know your feedback. If you are interested in timestamps, please send us an email to sales@haawks.com.

Comment

262 pips potential forex fx futures news trading profit from 6 events in January 2024 with Haawks G4A machine-readable data feed

Comment

262 pips potential forex fx futures news trading profit from 6 events in January 2024 with Haawks G4A machine-readable data feed

According to our analysis there was a potential of 262 pips / ticks profit out of the following 6 events in January 2024. The potential performance in 2023 was 13,607 pips / ticks.

January 2024

Cumulative potential, indicative performance January 2024, please see all releases below.

Total trading time would have been around 4 minutes! (preparation time not included)


Navigating the Waves of Economic Data: Understanding Market Reactions

In the dynamic world of finance, economic reports are the beacons that guide market participants through the turbulent seas of global markets. The beginning of 2024 has already showcased significant market reactions to key U.S. economic data releases, underscoring the importance of staying informed and agile in the face of new information. Let's delve into some of the pivotal reports that have shaped market movements recently and explore their broader implications.

US BLS Job Openings and Labor Turnover Survey (JOLT)

On January 3, 2024, the market witnessed a 28 pips movement in response to the Job Openings and Labor Turnover Survey (JOLT) released by the Bureau of Labor Statistics. This report, a critical gauge of labor market health, offers insights into job vacancies, hires, and separations. Such data is indispensable for understanding the underlying dynamics of the labor market, influencing monetary policy decisions and investor sentiment alike.

US Employment Situation (Non-farm payrolls / NFP)

The Non-farm Payroll (NFP) report, released on January 5, led to a 74 pips fluctuation, reflecting its status as one of the most anticipated economic indicators. The NFP measures employment changes in the U.S. economy, excluding farm workers and several other categories. Its significant impact on markets stems from its ability to sway Federal Reserve policy, affecting interest rates, inflation expectations, and overall economic outlook.

USDA WASDE and Grain Stocks Reports

Agricultural markets were not left untouched, with the USDA's World Agricultural Supply and Demand Estimates (WASDE) and Grain Stocks reports on January 12 causing a 48 ticks movement. These reports provide critical information on agricultural production, stocks, and price forecasts, influencing commodity markets and related sectors. Investors and producers alike scrutinize these releases to make informed decisions in a sector that is highly susceptible to changes in supply and demand dynamics.

DOE Petroleum Status Report

The Department of Energy's Petroleum Status Report on January 18 resulted in a 44 ticks movement, highlighting the energy sector's sensitivity to supply and demand shifts. This weekly report offers insights into crude oil inventories, production, and imports - key factors that directly impact oil prices and, by extension, the broader energy market and economic environment.

University of Michigan Consumer Sentiment

The University of Michigan's Consumer Sentiment and Inflation Expectations survey, released on January 19, led to a 20 pips movement. This indicator is a vital measure of consumer confidence, influencing consumption patterns and serving as a predictor of future economic activity. Changes in consumer sentiment can affect retail sales, housing markets, and overall economic growth, making this report a closely watched indicator.

US Gross Domestic Product (GDP)

Lastly, the U.S. Gross Domestic Product (GDP) report on January 25 caused a 48 pips shift, underscoring the paramount importance of GDP data in assessing the economy's health. As the broadest measure of economic activity, GDP growth rates directly influence investment decisions, policy making, and market sentiment. This report provides a comprehensive overview of the economy's performance, offering insights into trends in growth and potential future directions.

Conclusion

The early days of 2024 have already provided a vivid illustration of how economic data releases can drive market volatility. For investors, traders, and policymakers, understanding these reports is crucial for navigating the financial markets successfully. Each piece of data not only offers a snapshot of current conditions but also signals potential future trends. As we continue to sail through the year, staying informed and adaptive to new information will be key to making informed decisions in the ever-evolving landscape of global finance.

Disclaimer: This blog post is for informational purposes only and should not be construed as financial advice. Always conduct thorough research and consider seeking advice from a financial professional before making any investment decisions.


Start futures/forex/oil/grains news trading with Haawks G4A low latency machine-readable data today, we offer one of the fastest machine-readable data feeds for US economic and commodity data and economic data from Norway, Sweden, Turkey and ECB interest rates and statement.

Please let us know your feedback and check out our G4A low latency data feed.

All data is machine readable and available via API access in Aurora, CH1, NY4 and LD4. Free trials.

Comment

Comment

48 pips potential profit in 2 seconds on 25 January 2024, analysis on futures forex fx low latency news trading USDJPY and EURUSD on US Gross Domestic Product (GDP)

According to our analysis USDJPY and EURUSD moved 48 pips on US Gross Domestic Product (GDP) data on 25 January 2024.

USDJPY (35 pips)

EURUSD (13 pips)

Charts are exported from JForex (Dukascopy).


The advance estimate of the U.S. Gross Domestic Product (GDP) for the fourth quarter of 2023 shows a 3.3% annual growth rate, a slight deceleration from the 4.9% increase in the third quarter. Key growth drivers included consumer spending, exports, government spending, and investments in nonresidential and residential sectors. Consumer spending rose notably in services and goods, with significant contributions from health care and recreational goods. Increases in federal spending were more evident in nondefense areas, while state and local government spending also rose.

Both imports and exports increased, with exports led by petroleum and financial services. However, the fourth quarter saw a slowdown in private inventory investment, federal government spending, residential fixed investment, and consumer spending.

For the entire year of 2023, the real GDP grew by 2.5%, supported by consumer spending, nonresidential fixed investment, government spending, and exports, reaching a current-dollar GDP of $27.36 trillion, a 6.3% increase. Inflation indicators, such as the price index for gross domestic purchases and the personal consumption expenditures (PCE) price index, increased but at a slower rate compared to 2022. Personal income and disposable personal income also saw increases, though the personal saving rate dropped slightly to 4.0% in the fourth quarter.

The report, based on preliminary data, is subject to revision, with a more comprehensive update scheduled for February 28, 2024.

Source: https://www.bea.gov/news/2024/gross-domestic-product-fourth-quarter-and-year-2023-advance-estimate


Start futures forex fx news trading with Haawks G4A low latency machine-readable data, one of the fastest machine-readable news trading feeds for US economic and commodity data.

Please let us know your feedback. If you are interested in timestamps, please send us an email to sales@haawks.com.

Comment

Comment

20 pips potential profit in 1 second on 19 January 2024, analysis on futures forex fx low latency news trading USDJPY and EURUSD on University Michigan Consumer Sentiment / Inflation Expectations

According to our analysis USDJPY and EURUSD moved 20 pips on University Michigan Consumer Sentiment / Inflation Expectations data on 19 January 2024.

USDJPY (13 pips)

EURUSD (7 pips)

Charts are exported from JForex (Dukascopy).


The preliminary results for January 2024 from the Surveys of Consumers indicate a significant improvement in consumer sentiment in the United States. Here are some key highlights from the data:

  1. Index of Consumer Sentiment: This index saw a notable increase, rising to 78.8 in January 2024 from 69.7 in December 2023, which is a 13.1% monthly increase and a 21.4% increase compared to January 2023.

  2. Current Economic Conditions: This metric also showed improvement, increasing to 83.3 in January 2024 from 73.3 in December 2023, marking a 13.6% rise month-over-month and a 21.6% rise year-over-year.

  3. Index of Consumer Expectations: It rose to 75.9 in January 2024, up from 67.4 in December 2023, reflecting a 12.6% increase month-over-month and a 21.2% increase year-over-year.

  4. Consumer Sentiment Dynamics: The report highlights that consumer sentiment has significantly risen, reaching its highest level since July 2021. This improvement is attributed to increased confidence in inflation control and strengthening income expectations. Over the last two months, sentiment has seen the largest two-month increase since 1991, signaling a robust recovery from the all-time low in June 2022.

  5. Broad-Based Improvement: The improvement in consumer sentiment is noted across various demographics including age, income, education, and geography. Both Democrats and Republicans showed their most favorable readings since summer of 2021.

  6. Inflation Expectations: The year-ahead inflation expectations have decreased to 2.9%, the lowest since December 2020. Long-term inflation expectations have also edged down to 2.8%. These figures are slightly higher than the pre-pandemic levels but show a trend towards stabilization.

  7. Economic Outlook: The report suggests that the increase in consumer sentiment is likely to provide positive momentum for the economy. The sentiment is now approaching the historical average since 1978, being just 7% shy of it.

This data reflects a positive trend in consumer confidence, which is crucial for economic growth as it often leads to increased consumer spending. The softened inflation expectations indicate a stabilization in the economic outlook, which could positively impact various sectors of the economy.

Source: http://www.sca.isr.umich.edu


Start futures and forex fx news trading with Haawks G4A low latency machine-readable data, one of the fastest machine-readable news trading feeds for US macro-economic and commodity data.

Please let us know your feedback. If you are interested in timestamps, please send us an email to sales@haawks.com.

Comment

Comment

44 ticks potential profit in 62 seconds on 18 January 2024, analysis on futures forex fx low latency news trading crude oil on DOE Petroleum Status Report data

According to our analysis crude oil moved 44 ticks on DOE Petroleum Status Report data on 18 January 2024.

Light sweet crude oil (23 ticks)

Brent crude oil (21 ticks)

Charts are exported from JForex (Dukascopy).


The Weekly Petroleum Data for the week ending January 12, 2024, presents several key insights into the U.S. petroleum industry:

  1. Refinery Inputs and Capacity: U.S. crude oil refinery inputs averaged 16.7 million barrels per day, an increase of 135 thousand barrels per day from the previous week. Refineries operated at 92.6% of their operable capacity.

  2. Production Changes:

    • Gasoline Production: Decreased, averaging 9.4 million barrels per day.

    • Distillate Fuel Production: Also decreased, averaging 4.9 million barrels per day.

  3. Crude Oil Imports: Averaged 7.4 million barrels per day, up by 1.2 million barrels from the previous week. Over the past four weeks, the average was 6.7 million barrels per day, 6.6% higher than the same period last year.

  4. Gasoline and Distillate Fuel Imports:

    • Gasoline imports averaged 549 thousand barrels per day.

    • Distillate fuel imports averaged 115 thousand barrels per day.

  5. Crude Oil Inventories:

    • Decreased by 2.5 million barrels from the previous week.

    • At 429.9 million barrels, they are around 3% below the five-year average for this time of year.

  6. Gasoline and Distillate Inventories:

    • Total motor gasoline inventories increased by 3.1 million barrels, slightly above the five-year average.

    • Distillate fuel inventories increased by 2.4 million barrels, about 3% below the five-year average.

    • Propane/propylene inventories decreased by 2.8 million barrels, 13% above the five-year average.

  7. Total Commercial Petroleum Inventories: Increased by 2.8 million barrels last week.

  8. Total Products Supplied: Over the last four weeks, it averaged 20.0 million barrels per day, a 1.3% increase from the same period last year. Notably:

    • Motor gasoline product supplied averaged 8.4 million barrels per day, up by 3.9%.

    • Distillate fuel product supplied averaged 3.4 million barrels per day, down by 5.6%.

    • Jet fuel product supplied was up 6.2%.

This report indicates a mixed dynamic in the U.S. petroleum market with changes in production, imports, and inventory levels.

Source: https://ir.eia.gov/wpsr/wpsrsummary.pdf


Start futures forex fx crude oil news trading with Haawks G4A low latency machine-readable data, one of the fastest data feeds for DOE Petroleum Status Report data.

Please let us know your feedback. If you are interested in timestamps, please send us an email to sales@haawks.com.

Comment

48 ticks potential profit on 12 January 2024, analysis on trading soybeans futures on USDA WASDE and USDA Grain Stocks data

Comment

48 ticks potential profit on 12 January 2024, analysis on trading soybeans futures on USDA WASDE and USDA Grain Stocks data

According to our analysis soybeans (ZS) futures prices moved around 48 ticks on USDA WASDE (World Agricultural Supply and Demand Estimates) and USDA Grain Stocks data on 12 January 2024.

Soybeans (48 ticks)

Charts are exported from JForex (Dukascopy).


WASDE Report (January 2024) - Key Highlights:

  • Wheat: U.S. wheat ending stocks lowered due to decreased supplies, offset by less use. Global wheat outlook shows increased supplies, consumption, trade, and ending stocks.

  • Corn: U.S. corn production at a record high, leading to greater production and higher ending stocks. Globally, coarse grain production is forecasted to increase.

  • Rice: Slightly higher U.S. rice supplies and higher ending stocks. Globally, a decrease in supplies, consumption, trade, and ending stocks.

  • Oilseeds: U.S. oilseed production up, led by increases in soybean, rapeseed, and sunflowerseed crops. Global soybean production slightly raised.

  • Sugar: Mexico's sugar production projected lower. U.S. sugar supply increased due to higher production and imports.

  • Livestock, Poultry, and Dairy: Increased production in beef, pork, and broiler for 2023. Adjustments in exports and imports across various animal products.

  • Cotton: U.S. cotton forecasts show lower production, exports, and ending stocks. Globally, ending stocks are forecasted higher.

NASS Corn, Soybean, and Wheat Stocks Report (as of December 1, 2023):

  • Corn Stocks: Total of 12.2 billion bushels, up 13% from the previous year. On-farm stocks increased by 16%, and off-farm stocks up by 7%.

  • Soybean Stocks: Total of 3.00 billion bushels, down 1% from the previous year. On-farm stocks decreased by 2%, while off-farm stocks slightly increased.

  • Wheat Stocks: Total of 1.41 billion bushels, up 8% from the previous year. On-farm stocks increased by 9%, and off-farm stocks rose by 7%.

These reports provide a comprehensive overview of the current state and projections for key agricultural commodities in the U.S., including their production, stocks, and expected market dynamics. The WASDE report's insights are crucial for global agricultural markets, while the NASS stock data specifically informs about the domestic supply levels of corn, soybeans, and wheat. Both sets of information are essential for market analysts, policymakers, and stakeholders in the agricultural sector for informed decision-making and market analysis.

Source: https://www.usda.gov/oce/commodity/wasde/wasde0124.pdf, https://downloads.usda.library.cornell.edu/usda-esmis/files/xg94hp534/vd66xk611/4m90gh16q/grst0124.pdf


Haawks G4A is one of the fastest machine-readable data feeds for USDA data. We are beating big names in the industry by seconds. Coverage includes monthly USDA WASDE (World Agricultural Supply and Demand Estimates), quarterly USDA Grain Stocks and yearly USDA Prospective Plantings and USDA Acreage.

Please let us know your feedback. If you are interested in timestamps, please send us an email to sales@haawks.com.

Comment