Comment

20 pips potential profit in 1 second on 19 January 2024, analysis on futures forex fx low latency news trading USDJPY and EURUSD on University Michigan Consumer Sentiment / Inflation Expectations

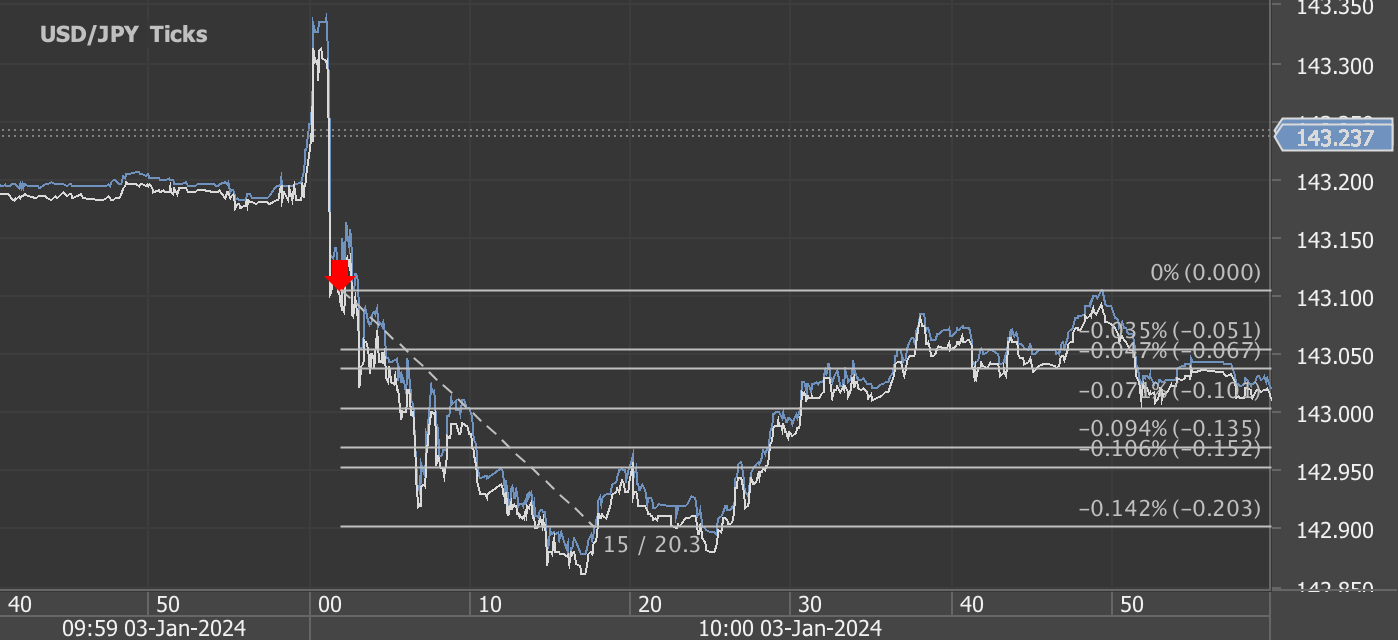
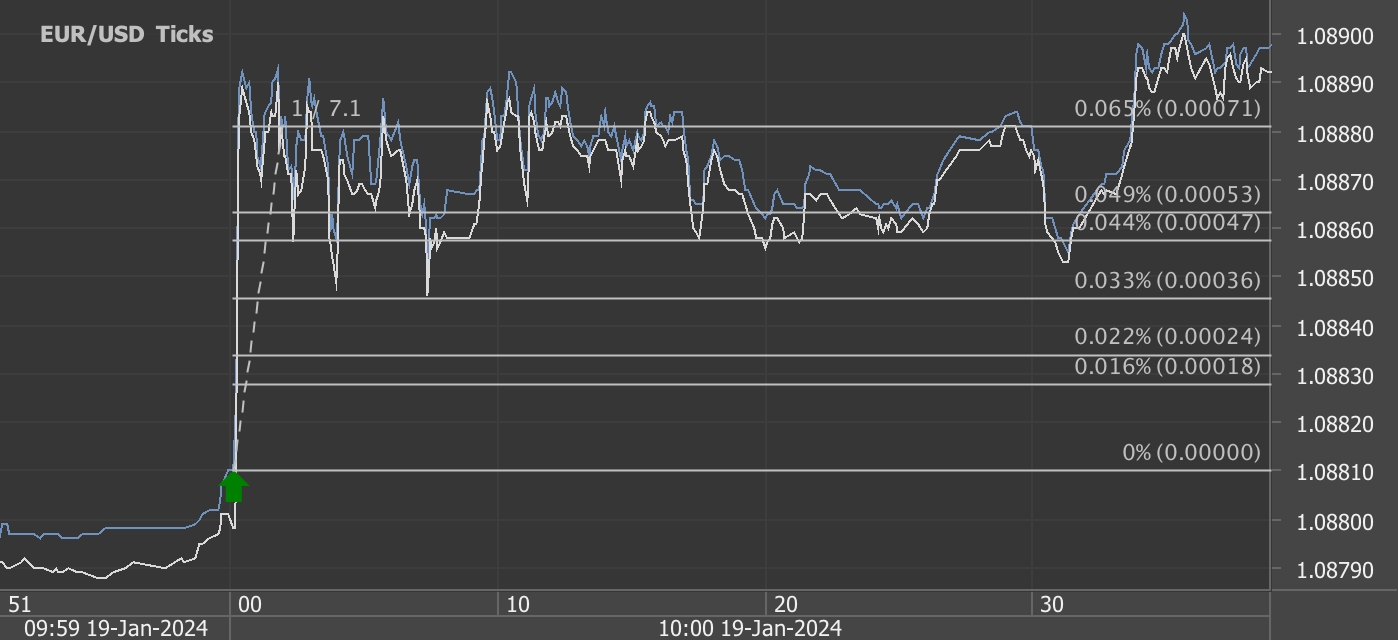
According to our analysis USDJPY and EURUSD moved 20 pips on University Michigan Consumer Sentiment / Inflation Expectations data on 19 January 2024.

USDJPY (13 pips)

EURUSD (7 pips)

Charts are exported from JForex (Dukascopy).


The preliminary results for January 2024 from the Surveys of Consumers indicate a significant improvement in consumer sentiment in the United States. Here are some key highlights from the data:

  1. Index of Consumer Sentiment: This index saw a notable increase, rising to 78.8 in January 2024 from 69.7 in December 2023, which is a 13.1% monthly increase and a 21.4% increase compared to January 2023.

  2. Current Economic Conditions: This metric also showed improvement, increasing to 83.3 in January 2024 from 73.3 in December 2023, marking a 13.6% rise month-over-month and a 21.6% rise year-over-year.

  3. Index of Consumer Expectations: It rose to 75.9 in January 2024, up from 67.4 in December 2023, reflecting a 12.6% increase month-over-month and a 21.2% increase year-over-year.

  4. Consumer Sentiment Dynamics: The report highlights that consumer sentiment has significantly risen, reaching its highest level since July 2021. This improvement is attributed to increased confidence in inflation control and strengthening income expectations. Over the last two months, sentiment has seen the largest two-month increase since 1991, signaling a robust recovery from the all-time low in June 2022.

  5. Broad-Based Improvement: The improvement in consumer sentiment is noted across various demographics including age, income, education, and geography. Both Democrats and Republicans showed their most favorable readings since summer of 2021.

  6. Inflation Expectations: The year-ahead inflation expectations have decreased to 2.9%, the lowest since December 2020. Long-term inflation expectations have also edged down to 2.8%. These figures are slightly higher than the pre-pandemic levels but show a trend towards stabilization.

  7. Economic Outlook: The report suggests that the increase in consumer sentiment is likely to provide positive momentum for the economy. The sentiment is now approaching the historical average since 1978, being just 7% shy of it.

This data reflects a positive trend in consumer confidence, which is crucial for economic growth as it often leads to increased consumer spending. The softened inflation expectations indicate a stabilization in the economic outlook, which could positively impact various sectors of the economy.

Source: http://www.sca.isr.umich.edu


Start futures and forex fx news trading with Haawks G4A low latency machine-readable data, one of the fastest machine-readable news trading feeds for US macro-economic and commodity data.

Please let us know your feedback. If you are interested in timestamps, please send us an email to sales@haawks.com.

Comment

Comment

44 ticks potential profit in 62 seconds on 18 January 2024, analysis on futures forex fx low latency news trading crude oil on DOE Petroleum Status Report data

According to our analysis crude oil moved 44 ticks on DOE Petroleum Status Report data on 18 January 2024.

Light sweet crude oil (23 ticks)

Brent crude oil (21 ticks)

Charts are exported from JForex (Dukascopy).


The Weekly Petroleum Data for the week ending January 12, 2024, presents several key insights into the U.S. petroleum industry:

  1. Refinery Inputs and Capacity: U.S. crude oil refinery inputs averaged 16.7 million barrels per day, an increase of 135 thousand barrels per day from the previous week. Refineries operated at 92.6% of their operable capacity.

  2. Production Changes:

    • Gasoline Production: Decreased, averaging 9.4 million barrels per day.

    • Distillate Fuel Production: Also decreased, averaging 4.9 million barrels per day.

  3. Crude Oil Imports: Averaged 7.4 million barrels per day, up by 1.2 million barrels from the previous week. Over the past four weeks, the average was 6.7 million barrels per day, 6.6% higher than the same period last year.

  4. Gasoline and Distillate Fuel Imports:

    • Gasoline imports averaged 549 thousand barrels per day.

    • Distillate fuel imports averaged 115 thousand barrels per day.

  5. Crude Oil Inventories:

    • Decreased by 2.5 million barrels from the previous week.

    • At 429.9 million barrels, they are around 3% below the five-year average for this time of year.

  6. Gasoline and Distillate Inventories:

    • Total motor gasoline inventories increased by 3.1 million barrels, slightly above the five-year average.

    • Distillate fuel inventories increased by 2.4 million barrels, about 3% below the five-year average.

    • Propane/propylene inventories decreased by 2.8 million barrels, 13% above the five-year average.

  7. Total Commercial Petroleum Inventories: Increased by 2.8 million barrels last week.

  8. Total Products Supplied: Over the last four weeks, it averaged 20.0 million barrels per day, a 1.3% increase from the same period last year. Notably:

    • Motor gasoline product supplied averaged 8.4 million barrels per day, up by 3.9%.

    • Distillate fuel product supplied averaged 3.4 million barrels per day, down by 5.6%.

    • Jet fuel product supplied was up 6.2%.

This report indicates a mixed dynamic in the U.S. petroleum market with changes in production, imports, and inventory levels.

Source: https://ir.eia.gov/wpsr/wpsrsummary.pdf


Start futures forex fx crude oil news trading with Haawks G4A low latency machine-readable data, one of the fastest data feeds for DOE Petroleum Status Report data.

Please let us know your feedback. If you are interested in timestamps, please send us an email to sales@haawks.com.

Comment

48 ticks potential profit on 12 January 2024, analysis on trading soybeans futures on USDA WASDE and USDA Grain Stocks data

Comment

48 ticks potential profit on 12 January 2024, analysis on trading soybeans futures on USDA WASDE and USDA Grain Stocks data

According to our analysis soybeans (ZS) futures prices moved around 48 ticks on USDA WASDE (World Agricultural Supply and Demand Estimates) and USDA Grain Stocks data on 12 January 2024.

Soybeans (48 ticks)

Charts are exported from JForex (Dukascopy).


WASDE Report (January 2024) - Key Highlights:

  • Wheat: U.S. wheat ending stocks lowered due to decreased supplies, offset by less use. Global wheat outlook shows increased supplies, consumption, trade, and ending stocks.

  • Corn: U.S. corn production at a record high, leading to greater production and higher ending stocks. Globally, coarse grain production is forecasted to increase.

  • Rice: Slightly higher U.S. rice supplies and higher ending stocks. Globally, a decrease in supplies, consumption, trade, and ending stocks.

  • Oilseeds: U.S. oilseed production up, led by increases in soybean, rapeseed, and sunflowerseed crops. Global soybean production slightly raised.

  • Sugar: Mexico's sugar production projected lower. U.S. sugar supply increased due to higher production and imports.

  • Livestock, Poultry, and Dairy: Increased production in beef, pork, and broiler for 2023. Adjustments in exports and imports across various animal products.

  • Cotton: U.S. cotton forecasts show lower production, exports, and ending stocks. Globally, ending stocks are forecasted higher.

NASS Corn, Soybean, and Wheat Stocks Report (as of December 1, 2023):

  • Corn Stocks: Total of 12.2 billion bushels, up 13% from the previous year. On-farm stocks increased by 16%, and off-farm stocks up by 7%.

  • Soybean Stocks: Total of 3.00 billion bushels, down 1% from the previous year. On-farm stocks decreased by 2%, while off-farm stocks slightly increased.

  • Wheat Stocks: Total of 1.41 billion bushels, up 8% from the previous year. On-farm stocks increased by 9%, and off-farm stocks rose by 7%.

These reports provide a comprehensive overview of the current state and projections for key agricultural commodities in the U.S., including their production, stocks, and expected market dynamics. The WASDE report's insights are crucial for global agricultural markets, while the NASS stock data specifically informs about the domestic supply levels of corn, soybeans, and wheat. Both sets of information are essential for market analysts, policymakers, and stakeholders in the agricultural sector for informed decision-making and market analysis.

Source: https://www.usda.gov/oce/commodity/wasde/wasde0124.pdf, https://downloads.usda.library.cornell.edu/usda-esmis/files/xg94hp534/vd66xk611/4m90gh16q/grst0124.pdf


Haawks G4A is one of the fastest machine-readable data feeds for USDA data. We are beating big names in the industry by seconds. Coverage includes monthly USDA WASDE (World Agricultural Supply and Demand Estimates), quarterly USDA Grain Stocks and yearly USDA Prospective Plantings and USDA Acreage.

Please let us know your feedback. If you are interested in timestamps, please send us an email to sales@haawks.com.

Comment

Comment

74 pips potential profit in 62 seconds on 5 January 2024, analysis on forex fx futures news trading USDJPY and EURUSD on US Employment Situation (Non-farm payrolls/NFP) data

According to our analysis USDJPY and EURUSD moved around 74 pips on US Employment Situation (Non-farm payrolls / NFP) data on 5 January 2024.

USDJPY (50 pips)

EURUSD (24 pips)

Charts are exported from JForex (Dukascopy).


The December 2023 Employment Situation Summary, released by the U.S. Bureau of Labor Statistics, presents a comprehensive overview of the United States labor market for that month. Key points include:

  1. Nonfarm Payroll Employment Increase: There was an increase of 216,000 jobs, with notable growth in government, health care, social assistance, and construction sectors. However, there were job losses in transportation and warehousing.

  2. Stable Unemployment Rate: The unemployment rate remained constant at 3.7 percent.

  3. Unemployment Statistics by Group: Unemployment rates for various demographic groups, including adult men and women, teenagers, and different ethnic groups, showed little change.

  4. Long-term Unemployment: The count of long-term unemployed people (jobless for 27 weeks or more) stood at 1.2 million, making up 19.7 percent of all unemployed persons.

  5. Labor Force Participation: Both the labor force participation rate and the employment-population ratio saw a minor decrease of 0.3 percentage points.

  6. Part-Time and Marginal Employment: About 4.2 million individuals were employed part-time for economic reasons. There was a slight increase in the number of people not in the labor force who wanted a job, reaching 5.7 million.

  7. Sector-Specific Employment Trends: Increases in employment were observed in local and federal government, health care, and construction. On the other hand, transportation and warehousing sectors experienced a decline.

  8. Earnings and Work Hours: Average hourly earnings rose by 15 cents, with a year-over-year increase of 4.1 percent. The average workweek for all employees decreased slightly.

  9. Data Revisions: The report included downward revisions for job gains in October and November, with a combined reduction of 71,000 jobs from previous estimates.

Overall, the report indicates a continued increase in employment across several sectors with a stable unemployment rate, offering a detailed snapshot of the U.S. labor market as of December 2023.

Source: https://www.bls.gov/news.release/empsit.nr0.htm


Start forex fx futures news trading with Haawks G4A low latency machine-readable data today, one of the fastest news data feeds for US economic and commodity data.

Please let us know your feedback. If you are interested in timestamps, please send us an email to sales@haawks.com.

Comment

1 Comment

28 pips potential profit in 15 seconds on 3 January 2024, analysis on futures forex fx news trading EURUSD and USDJPY on US BLS Job Openings and Labor Turnover Survey (JOLT) data

According to our analysis USDJPY and EURUSD moved 28 pips on US BLS Job Openings and Labor Turnover Survey (JOLT) data on 3 January 2024.

USDJPY (20 pips)

EURUSD (8 pips)

Charts are exported from JForex (Dukascopy).


The Job Openings and Labor Turnover Summary for November 2023, released by the U.S. Bureau of Labor Statistics, presents a detailed overview of the labor market dynamics during that month. Key points from the summary include:

  1. Job Openings: The number of job openings remained relatively stable at 8.8 million, a slight decrease from the series high of 12.0 million in March 2022. The job openings rate was unchanged at 5.3%. Notably, there were decreases in job openings in transportation, warehousing, and utilities, as well as in the federal government, while there was an increase in wholesale trade.

  2. Hires: There was a decrease in hires to 5.5 million, with the hires rate remaining relatively stable at 3.5%. The most significant reduction in hires was observed in professional and business services.

  3. Separations: Total separations, which include quits, layoffs and discharges, and other separations, decreased to 5.3 million. This category covers voluntary separations (quits), involuntary separations (layoffs and discharges), and other separations such as retirements, deaths, or transfers. The rate of total separations remained fairly stable.

  4. Quits and Layoffs/Discharges: The number of quits slightly decreased to 3.5 million, with a minor decrease in the quits rate. The number of layoffs and discharges remained steady at 1.5 million. Notable decreases in quits were in professional and business services and educational services.

  5. Other Separations: There was little change in the number of other separations, which stood at 342,000.

  6. Establishment Size Class: For establishments with 1 to 9 employees, there was little change in job openings, hires, and total separations rates. However, for larger establishments with 5,000 or more employees, there was an increase in the quits rate and total separations rate.

The next set of estimates, for December 2023, is scheduled to be released on January 30, 2024. This summary provides insights into the employment trends and shifts in various sectors, which are crucial for understanding the current state of the labor market.

Source: https://www.bls.gov/news.release/jolts.nr0.htm


Start futures #forex fx news #trading with Haawks G4A low latency machine-readable data today, one of the fastest news data feeds for US economic and commodity data.

Please let us know your feedback. If you are interested in timestamps, please send us an email to sales@haawks.com.

1 Comment

1261 pips potential forex fx futures news trading profit from 9 events in December 2023 with Haawks G4A machine-readable data feed (Correction)

Comment

1261 pips potential forex fx futures news trading profit from 9 events in December 2023 with Haawks G4A machine-readable data feed (Correction)

According to our analysis there was a potential of 1261 pips / ticks profit out of the following 9 events in December 2023. The potential performance in 2023 was 13,607 pips / ticks.

December 2023

Cumulative potential, indicative performance December 2023, please see all releases below.

Total trading time would have been around 13 minutes! (preparation time not included)


Navigating the Waves of Economic Indicators: A Guide for News Traders

Embracing Market Dynamics: A Deep Dive into Recent Economic Releases

In the ever-changing landscape of financial markets, staying abreast of economic releases is crucial for news traders. The recent slew of data has provided a wealth of insights, impacting market dynamics and influencing trading strategies. Let's delve into some of the key economic indicators that have been shaping market trends:

  1. US BLS Job Openings and Labor Turnover Survey (JOLT) - December 5, 2023: The US Bureau of Labor Statistics reported a notable decrease in job openings to 8.7 million in October 2023. This decline in openings, coupled with relatively unchanged hires and separations, signals a shift in the employment landscape, potentially impacting sectors like health care, finance, and real estate.

  2. US Jobless Claims - December 7, 2023: A staple indicator of the labor market's health, jobless claims offer insights into the short-term employment trends, providing traders with cues on consumer spending and overall economic health.

  3. US Employment Situation (NFP) - December 8, 2023: The Non-farm Payrolls report is a critical barometer of economic health, influencing Federal Reserve policies and market sentiments. Its impact on currency and stock markets is profound, often triggering significant market volatility.

  4. University of Michigan Consumer Sentiment / Inflation Expectations - December 8, 2023: This index provides a snapshot of consumer confidence and inflation expectations, which are key drivers of economic activity. Changes in consumer sentiment can influence retail sales, housing markets, and overall economic growth.

  5. FOMC Interest Rate Decision and Projections - December 13, 2023: The Federal Reserve's decisions on interest rates shape the investment landscape. Rate changes affect borrowing costs, consumer spending, and are a pivotal factor for currency traders.

  6. Norway Interest Rate Decision (Norges Bank) - December 14, 2023: As a notable event for forex traders, especially those dealing with the Norwegian krone, the Norges Bank's decision can influence the currency's strength and Norway's economic outlook.

  7. US Gross Domestic Product (GDP) - December 21, 2023: The GDP report is a comprehensive measure of the US economic activity, influencing stock and bond markets. It offers insights into the economic growth trajectory and policy implications.

  8. US BEA Personal Income and Outlays & US Durable Goods Orders - December 22, 2023: Personal income and spending data shed light on consumer behavior, while durable goods orders indicate the health of manufacturing and broader business investment trends.

  9. DOE Petroleum Status Report - December 28, 2023: This report is crucial for energy traders, as it affects crude oil prices and, subsequently, the energy sector stocks and indices.

Strategic Implications for Traders:

  • Sector-Specific Analysis: Understanding which sectors are most affected by these reports helps in making targeted investment decisions.

  • Risk Management: Anticipating the market's reaction to these releases is vital. Volatility can be both an opportunity and a risk.

  • Long-term vs. Short-term: While some indicators like GDP offer a long-term view, others like jobless claims are more immediate in their impact.

  • Global Perspective: While focusing on US data, it's important to consider global economic indicators, as they can have cascading effects on global markets.

Conclusion:

For news traders, these economic releases are not just numbers but pivotal indicators that guide their trading strategies. By closely monitoring and analyzing these indicators, traders can gain an edge in the complex world of financial markets. Stay informed, stay agile, and let the data guide your way!

Disclaimer: This blog post is for informational purposes only and should not be construed as financial advice. Always conduct thorough research and consider seeking advice from a financial professional before making any investment decisions.


Start futures/forex/oil/grains news trading with Haawks G4A low latency machine-readable data today, we offer one of the fastest machine-readable data feeds for US economic and commodity data and economic data from Norway, Sweden, Turkey and ECB interest rates and statement.

Please let us know your feedback and check out our G4A low latency data feed.

All data is machine readable and available via API access in Aurora, CH1, NY4 and LD4. Free trials.

Comment

Comment

50 ticks potential profit in 46 seconds on 28 December 2023, analysis on futures forex fx low latency news trading crude oil on DOE Petroleum Status Report data

According to our analysis crude oil moved 50 ticks on DOE Petroleum Status Report data on 28 December 2023.

Light sweet crude oil (25 ticks)

Brent crude oil (25 ticks)

Charts are exported from JForex (Dukascopy).


The summary of the Weekly Petroleum Data for the week ending December 22, 2023, presents several key points regarding the United States' petroleum industry:

  1. Crude Oil Refinery Inputs and Capacity:

    • U.S. crude oil refinery inputs averaged 16.6 million barrels per day, an increase of 109 thousand barrels per day compared to the previous week.

    • Refineries operated at 93.3% of their operable capacity.

  2. Production of Gasoline and Distillate Fuel:

    • Gasoline production increased, averaging 10.0 million barrels per day.

    • Distillate fuel production also increased, averaging 5.1 million barrels per day.

  3. Crude Oil and Petroleum Product Imports:

    • U.S. crude oil imports averaged 6.3 million barrels per day, a decrease of 415 thousand barrels per day from the previous week.

    • Over the past four weeks, crude oil imports averaged about 6.7 million barrels per day, 8.2% higher than the same period last year.

    • Motor gasoline imports averaged 521 thousand barrels per day, and distillate fuel imports averaged 238 thousand barrels per day.

  4. Inventory Levels:

    • U.S. commercial crude oil inventories (excluding Strategic Petroleum Reserve) decreased by 6.9 million barrels from the previous week.

    • At 436.6 million barrels, inventories are approximately 1% below the five-year average for this time of year.

    • Motor gasoline inventories decreased by 0.6 million barrels and are around 2% below the five-year average.

    • Distillate fuel inventories increased by 0.8 million barrels but are about 9% below the five-year average.

    • Propane/propylene inventories decreased by 3.7 million barrels, yet they are 13% above the five-year average.

    • Total commercial petroleum inventories decreased by 17.3 million barrels.

  5. Product Supply and Demand:

    • Total products supplied over the last four weeks averaged 20.7 million barrels a day, down by 0.5% from the same period last year.

    • Motor gasoline product supplied averaged 8.8 million barrels a day, up by 1.6% from the same period last year.

    • Distillate fuel product supplied averaged 3.8 million barrels a day, up by 0.8% from last year.

    • Jet fuel product supplied increased

Source: https://ir.eia.gov/wpsr/wpsrsummary.pdf


Start futures forex fx crude oil news trading with Haawks G4A low latency machine-readable data, one of the fastest data feeds for DOE Petroleum Status Report data.

Please let us know your feedback. If you are interested in timestamps, please send us an email to sales@haawks.com.

Comment

Comment

38 pips potential profit in 80 seconds on 22 December 2023, analysis on futures forex fx news trading USDJPY and EURUSD on US BEA Personal Income and Outlays and US Durable Goods Orders data

According to our analysis USDJPY and EURUSD moved 38 pips on US BEA Personal Income and Outlays and US Durable Goods Orders data on 22 December 2023.

USDJPY (26 pips)

EURUSD (12 pips)

Charts are exported from JForex (Dukascopy).


Analyzing the Economic Pulse: Insights from BEA and Census Bureau Reports, November 2023

Introduction

As we approach the end of 2023, recent releases from the Bureau of Economic Analysis (BEA) and the U.S. Census Bureau offer valuable insights into the current state of the U.S. economy. The BEA's report on Personal Income and Outlays for November 2023 and the Census Bureau's report on Durable Goods Manufacturers' Shipments, Inventories, and Orders provide a comprehensive picture of economic trends, consumer behavior, and manufacturing health. Let's dive into the details.

BEA Report: A Closer Look at Personal Income and Spending

Income and Expenditures on the Rise

The BEA report highlights a modest increase in personal income, up by $81.6 billion (0.4%) in November. This uptick reflects growth in compensation and income receipts on assets. Disposable Personal Income (DPI) also rose by $71.9 billion (0.4%), indicating more money in the pockets of consumers.

Consumer Spending Patterns

Personal Consumption Expenditures (PCE) increased by $46.7 billion (0.2%). This growth, however, is nuanced. There was a noticeable shift in consumer spending, with a significant increase in services, particularly in housing, utilities, and food services. Conversely, spending on goods, especially gasoline and other energy goods, saw a decline.

The Saving Scenario

An intriguing aspect of the report is the personal saving rate, standing at 4.1% with a total personal saving of $839.8 billion. This figure reflects how consumers are balancing between spending and saving in the current economic landscape.

Census Bureau Report: Durable Goods Orders Indicate Manufacturing Health

A Surge in Durable Goods Orders

The Census Bureau's report brought positive news from the manufacturing sector. New orders for manufactured durable goods saw a substantial increase of $15.1 billion or 5.4% to $295.4 billion, signaling robust manufacturing activity.

Sector-Specific Trends

A significant contributor to this increase was the transportation equipment sector, soaring by $14.3 billion or 15.3% to $107.8 billion. Excluding transportation, new orders still saw a rise of 0.5%, indicating broad-based growth across the sector.

Implications for the Economy

The increase in durable goods orders, particularly excluding defense, which rose by 6.5%, suggests a growing demand in the civilian sector and potential future economic expansion.

Conclusion: Interpreting the Economic Signals

The November 2023 reports from the BEA and the Census Bureau paint a picture of an economy experiencing gradual growth in personal income and consumer spending, along with a healthy manufacturing sector. The rise in service spending and durable goods orders indicates consumer confidence and a resilient economy. However, the shift in spending patterns and the modest increase in the personal saving rate also suggest a degree of caution among consumers. As we move into 2024, these trends will be crucial for policymakers, businesses, and consumers to watch.

Source: https://www.bea.gov/news/2023/personal-income-and-outlays-november-2023, https://www.census.gov/manufacturing/m3/adv/current/index.html


Start futures #forex fx news #trading with Haawks G4A low latency machine-readable data today, one of the fastest news data feeds for US economic and commodity data.

Please let us know your feedback. If you are interested in timestamps, please send us an email to sales@haawks.com.

Comment

Comment

52 pips potential profit in 3 seconds on 21 December 2023, analysis on futures forex fx low latency news trading USDJPY and EURUSD on US Gross Domestic Product (GDP)

According to our analysis USDJPY and EURUSD moved 52 pips on US Gross Domestic Product (GDP) data on 21 December 2023.

USDJPY (39 pips)

EURUSD (13 pips)

Charts are exported from JForex (Dukascopy).


The third estimate of the U.S. Gross Domestic Product (GDP) for the third quarter of 2023, released by the Bureau of Economic Analysis, reveals several key economic trends:

  1. Real GDP Growth: There was a 4.9% annual increase in real GDP, slightly lower than the previously estimated 5.2%. This revision mainly reflects a decrease in consumer spending.

  2. Current-dollar GDP: Increased by 8.3%, reaching $27.61 trillion, with a minor downward revision from the prior estimate.

  3. GDP by Industry: Growth was seen across various sectors, with private goods-producing industries rising 10.2%, private services-producing industries 4.1%, and government 2.0%. Fourteen out of 22 industry groups contributed to this growth.

  4. Inflation Indicators: The price index for gross domestic purchases went up by 2.9%, while the personal consumption expenditures (PCE) price index increased by 2.6%. Excluding food and energy, the PCE price index rose by 2.0%.

  5. Personal Income and Savings: There was a notable increase in current-dollar personal income and a 2.9% rise in disposable personal income. The personal saving rate was revised upwards to 4.2%.

  6. Corporate Profits: Profits from current production rose by $108.7 billion, with increases in both financial and nonfinancial corporate sectors.

This report provides a comprehensive view of the U.S. economy's performance, indicating sustained growth with adjustments in consumer spending and corporate profits.

Source: https://www.bea.gov/news/2023/gross-domestic-product-third-estimate-corporate-profits-revised-estimate-and-gdp


Start futures forex fx news trading with Haawks G4A low latency machine-readable data, one of the fastest machine-readable news trading feeds for US economic and commodity data.

Please let us know your feedback. If you are interested in timestamps, please send us an email to sales@haawks.com.

Comment

Comment

907 pips potential profit in 99 seconds on 14 December 2023, analysis on forex fx news trading EURNOK first on Norway interest rate decision data

According to our analysis EURNOK moved 907 pips on Norway interest rate decision (Norges Bank) data on 14 December 2023.

CORRECTION (02/01/2024)

EURNOK (907 pips)

EURNOK (1142 pips)

Charts are exported from JForex (Dukascopy).


Norges Bank Raises Policy Rate: Balancing Act in a Cooling Economy

Introduction: In a move to address persistent inflationary pressures, Norges Bank's Monetary Policy and Financial Stability Committee decided to raise the policy rate from 4.25% to 4.5% at its meeting on December 13, 2023. This decision reflects a delicate balancing act, considering the ongoing economic cooling and the need to rein in high inflation. Let's delve into the key factors influencing this rate hike and its potential implications.

Inflationary Concerns: The primary driver behind the rate increase is the concern over inflation. Despite the economy experiencing a slowdown, inflation remains stubbornly above the 2% target. The Committee aims to prevent a prolonged period of high inflation, which could have adverse effects on the economy and impact low-income groups disproportionately.

Economic Overview: The Norwegian economy is navigating through a period of cooling, with household consumption decreasing and certain sectors, such as retail trade and construction, facing challenges. Employment remains high, but the labor market is showing signs of loosening, contributing to a cautious approach in the decision-making process.

Global Factors: Internationally, inflation is on a downward trajectory, and central banks worldwide are signaling a shift towards accommodative monetary policies. This global context influences Norges Bank's decision, aligning with a broader trend of central banks adjusting to changing economic conditions.

Challenges of the Krone Depreciation: The depreciation of the krone is a cause for concern. While it helps improve manufacturing profitability, it simultaneously contributes to higher imported goods inflation. This presents a challenge for the central bank in its efforts to curb overall inflation and maintain stability in the currency.

Policy Trade-offs: The rate decision underscores the challenging trade-offs facing policymakers. Striking a balance between preventing high inflation and avoiding excessive tightening to prevent economic contraction is a delicate task. The Committee acknowledges the need for a tight monetary policy stance but emphasizes the importance of avoiding over-tightening that could hinder economic growth.

Forward Guidance: Looking ahead, the Committee provides forward guidance indicating that the policy rate is likely to be maintained at 4.5% for some time. However, there is an expectation of a gradual decrease in the later part of 2024, depending on the evolving economic conditions. The approach is cautious, with flexibility to adjust the policy rate based on uncertainties in the economic outlook.

Conclusion: Norges Bank's decision to raise the policy rate reflects a nuanced response to the economic challenges at hand. As the economy experiences a cooling period, the central bank aims to balance the risks of inflation against the potential negative impacts of excessive tightening. The forward guidance provides a roadmap for the future, emphasizing adaptability to changing economic dynamics. As we move forward, monitoring how these decisions play out in the broader economic landscape will be crucial for businesses, investors, and households alike.

Source: https://www.norges-bank.no/en/topics/Monetary-policy/Monetary-policy-meetings/2023/december-2023


Start forex fx news trading with Haawks G4A low latency machine-readable data today, one of the fastest news data feeds for US and European macro-economic and US commodity data.

Please let us know your feedback. If you are interested in timestamps, please send us an email to sales@haawks.com.

Comment