According to our analysis natural gas moved 57 ticks on DOE Natural Gas Storage Report data on 16 November 2023.
Natural gas (57 ticks)
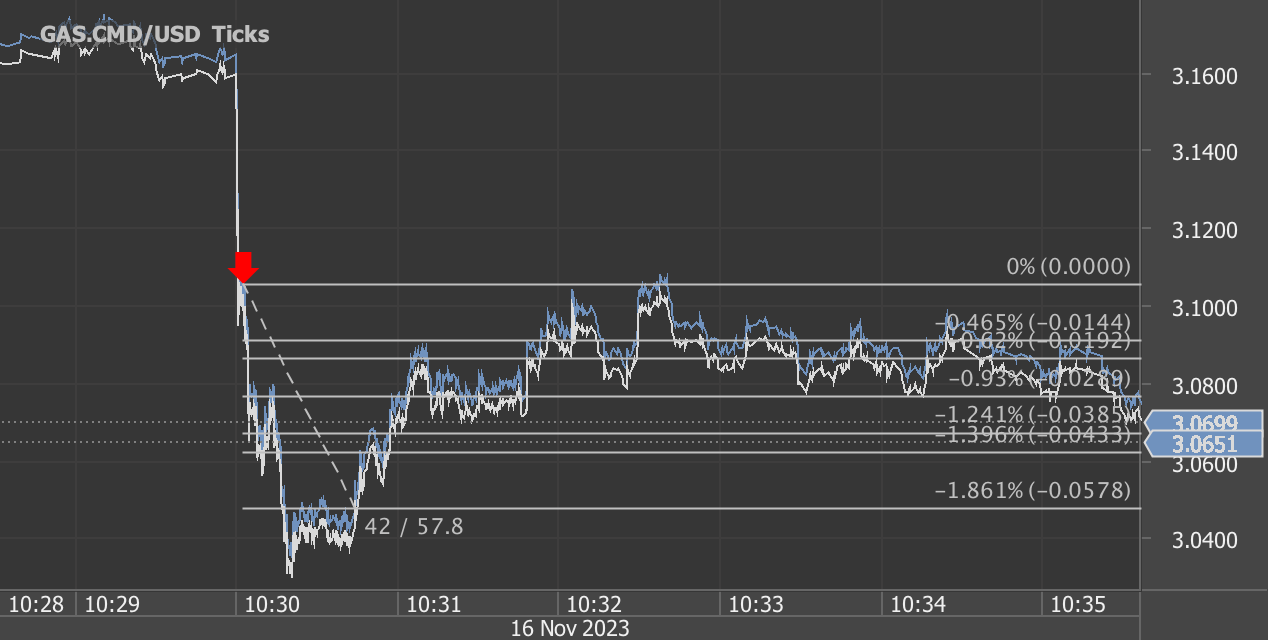
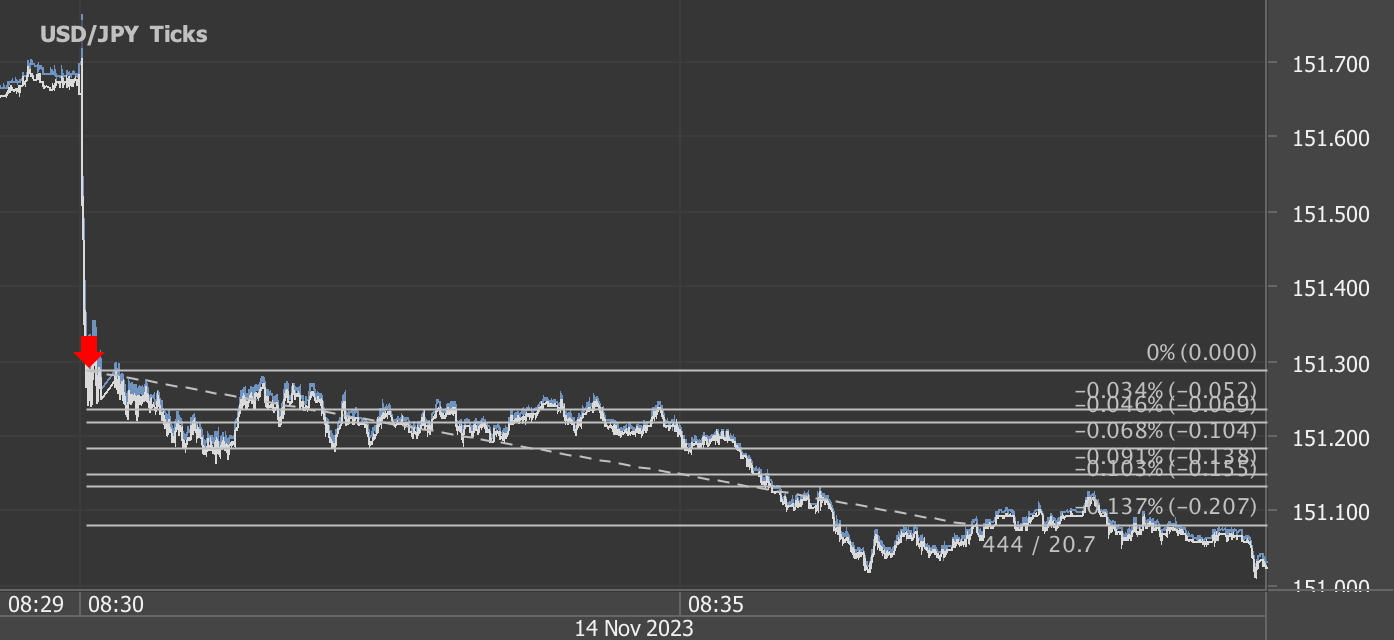
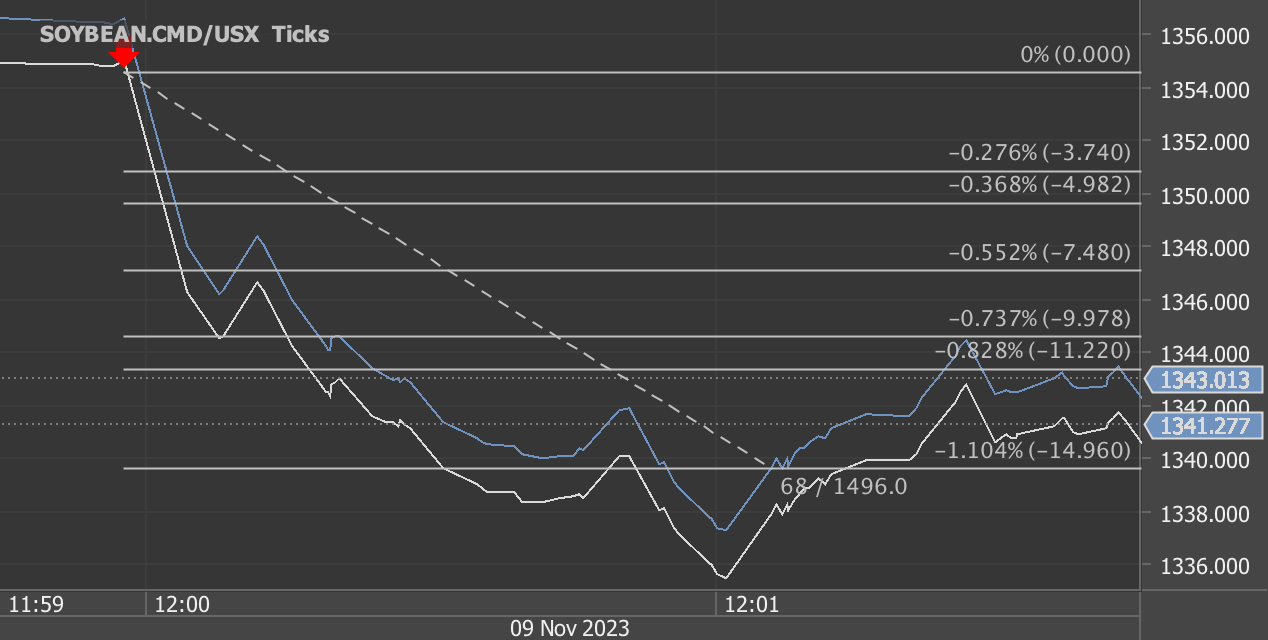
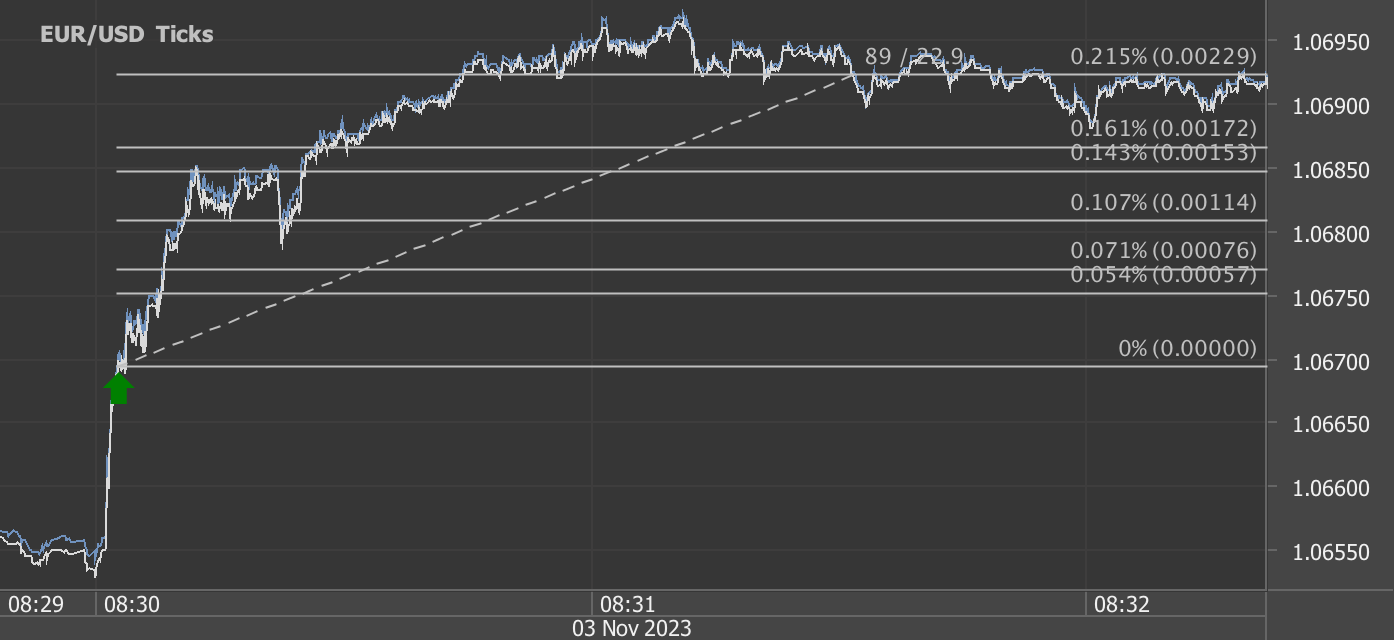
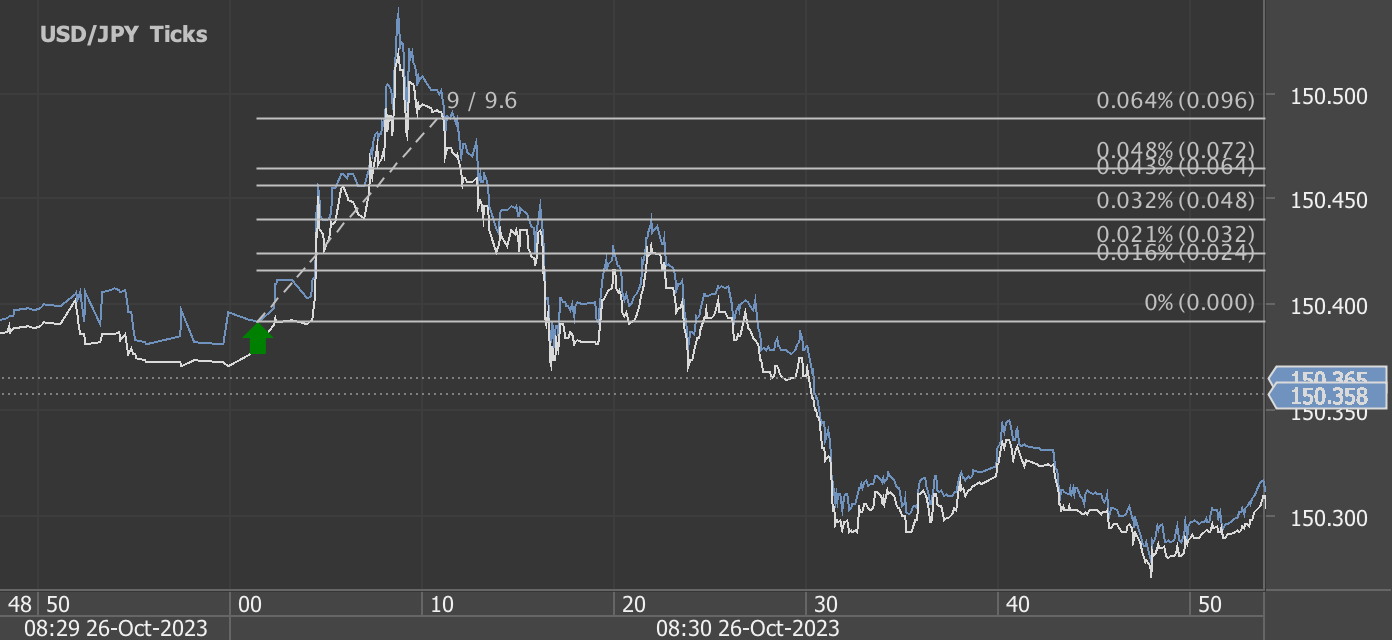
Charts are exported from JForex (Dukascopy).
The Weekly Natural Gas Storage Report provides information on the current status of natural gas storage in the United States. Here's a summary of the key data for the week ending November 10, 2023:
Working Gas in Underground Storage:
Total working gas in storage: 3,833 billion cubic feet (Bcf)
Net change from the previous week: +60 Bcf (an increase)
Working gas stocks compared to last year: +198 Bcf
Working gas stocks compared to the five-year average: +203 Bcf
Regional Breakdown:
East Region:
Working gas stocks: 931 Bcf
Net change: +7 Bcf
Compared to last year: +51 Bcf
Compared to the five-year average: +34 Bcf
Midwest Region:
Working gas stocks: 1,116 Bcf
Net change: +11 Bcf
Compared to last year: +34 Bcf
Compared to the five-year average: +34 Bcf
Mountain Region:
Working gas stocks: 256 Bcf
Net change: +3 Bcf
Compared to last year: +48 Bcf
Compared to the five-year average: +46 Bcf
Pacific Region:
Working gas stocks: 292 Bcf
Net change: +8 Bcf
Compared to last year: +50 Bcf
Compared to the five-year average: +16 Bcf
South Central Region:
Working gas stocks: 1,238 Bcf
Net change: +32 Bcf
Compared to last year: +65 Bcf
Compared to the five-year average: +65 Bcf
Salt Caverns: 332 Bcf (+19 Bcf)
Nonsalt Facilities: 906 Bcf (+13 Bcf)
Summary:
Total working gas in storage is within the five-year historical range.
The overall increase in working gas compared to the previous week was 60 Bcf.
Stocks are higher than both last year and the five-year average by 198 Bcf and 203 Bcf, respectively.
It's worth noting that the data is subject to independent rounding, and totals may not equal the sum of components. The next release of the Weekly Natural Gas Storage Report is scheduled for November 22, 2023.
Source: https://ir.eia.gov/ngs/ngs.html
Start futures forex fx commodity news trading with Haawks G4A low latency machine-readable data, one of the fastest data feeds for DOE data.
Please let us know your feedback. If you are interested in timestamps, please send us an email to sales@haawks.com.