According to our analysis US30 moved 154 points and BTC 592 points on University Michigan Consumer Sentiment / Inflation Expectations data on 14 March 2025.
US30 (154 points)

BTC (592 points)

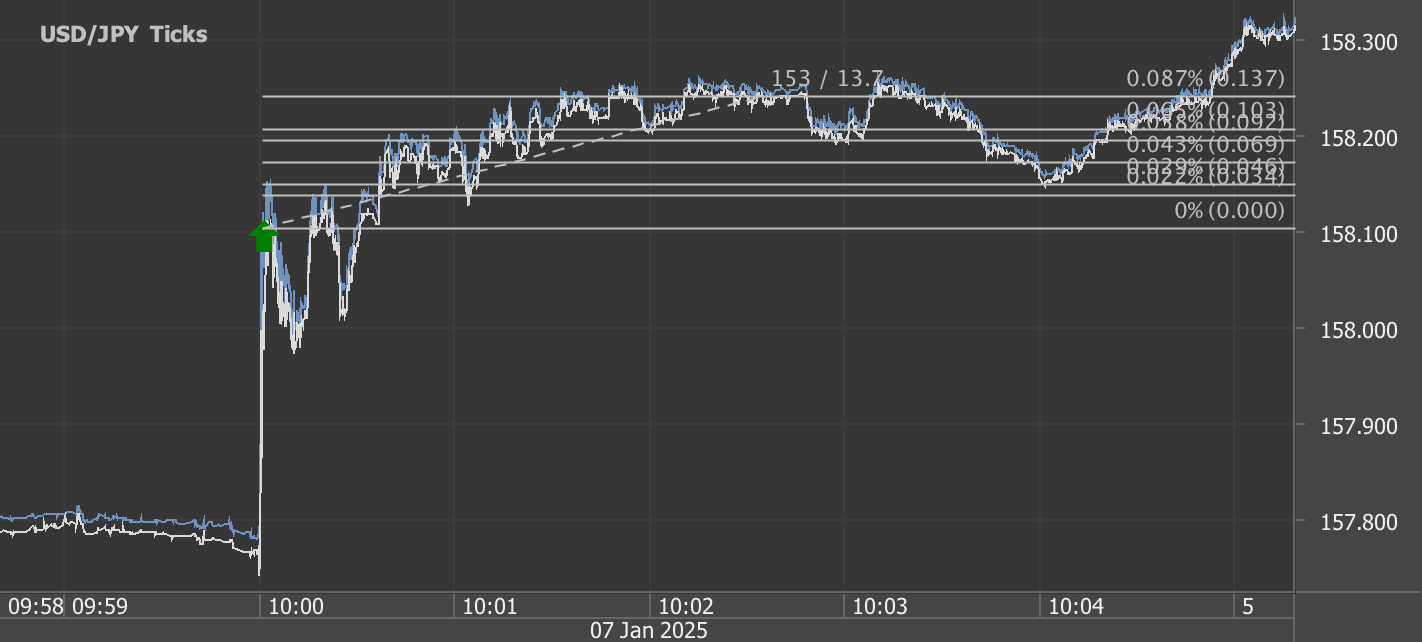
Charts are exported from JForex (Dukascopy).
Market Sentiment Crashes: What Traders Need to Know
March 2025 has delivered another major blow to consumer sentiment, marking the third consecutive month of decline. According to the preliminary data, the Index of Consumer Sentiment dropped 10.5% from February and a staggering 27.1% year-over-year. Economic uncertainty continues to rattle consumers and traders alike, with ripple effects visible across the markets.
Key Takeaways:
Consumer sentiment plunged to 57.9, down from 64.7 in February and 79.4 a year ago.
Economic expectations deteriorated sharply, with the Index of Consumer Expectations plummeting 15.3% month-over-month and 30.0% year-over-year.
Year-ahead inflation expectations surged to 4.9%, up from 4.3% last month, the highest reading since November 2022.
Long-run inflation expectations spiked to 3.9%, marking the biggest monthly jump since 1993.
Market reactions: The Dow Jones Industrial Average (US30) dropped 154 points, while Bitcoin (BTC) fell 592 points.
Breaking Down the Market Impact
Equities Market: Bearish Momentum Persists
Consumer sentiment is often a leading indicator of market performance, and the latest data suggests continued weakness. The 154-point drop in the Dow underscores mounting concerns about economic uncertainty and inflationary pressures.
Key sectors to watch:
Retail & Consumer Goods: With sentiment tumbling, discretionary spending could take a hit. Watch out for bearish trends in companies reliant on consumer confidence, such as major retailers and automakers.
Financials: Rising inflation expectations could push interest rates higher, impacting lending and borrowing costs. Banks may see short-term gains but long-term risks.
Technology: Growth stocks, particularly those sensitive to interest rate movements, may experience increased volatility.
Crypto Market: BTC’s Decline Reflects Risk Aversion
Bitcoin’s 592-point drop aligns with the broader trend of risk-off sentiment. Higher inflation expectations can lead to more aggressive monetary tightening, reducing liquidity and dampening demand for speculative assets like crypto. Traders should watch for:
Support Levels: BTC needs to hold key technical levels to prevent further downside pressure.
Macroeconomic Cues: Any hawkish signals from central banks could exacerbate selling pressure.
Altcoin Correlations: The broader crypto market tends to follow BTC’s lead, so caution is warranted across the board.
Trading Strategies in a Volatile Environment
Short-Term Plays:
Hedge Against Inflation: Consider commodities such as gold and energy stocks, which often perform well in inflationary environments.
Short Weak Sectors: Retail, consumer discretionary, and high-growth tech stocks may struggle in the current climate.
Play the Volatility: Options strategies like straddles or strangles could be useful given heightened uncertainty.
Long-Term Positioning:
Defensive Stocks: Sectors like healthcare, utilities, and consumer staples tend to be more resilient during economic downturns.
Dividend Payers: Stocks with strong dividend yields can provide stability amidst market turbulence.
Crypto Accumulation: If BTC continues to correct, long-term holders might find opportunities to buy on dips.
What’s Next?
The final March sentiment report is set for release on March 28, 2025. Until then, expect continued volatility as traders digest the latest data. The biggest wild card remains policy uncertainty—any shifts in fiscal or monetary policy could further disrupt market stability. Keep a close eye on inflation trends, central bank actions, and earnings reports for guidance on the next moves.
Stay sharp, stay hedged, and trade smart!
Disclaimer: This blog post is for informational purposes only and should not be construed as financial advice. Always conduct thorough research and consider seeking advice from a financial professional before making any investment decisions.
Source: http://www.sca.isr.umich.edu
Start futures and forex fx news trading with Haawks G4A low latency machine-readable data, one of the fastest machine-readable news trading feeds for US macro-economic and commodity data.
Please let us know your feedback. If you are interested in timestamps, please send us an email to sales@haawks.com.