Viewing entries tagged
WASDE

40 ticks potential profit on 11 February 2025, analysis on trading corn and wheat futures on USDA WASDE data

Comment

40 ticks potential profit on 11 February 2025, analysis on trading corn and wheat futures on USDA WASDE data

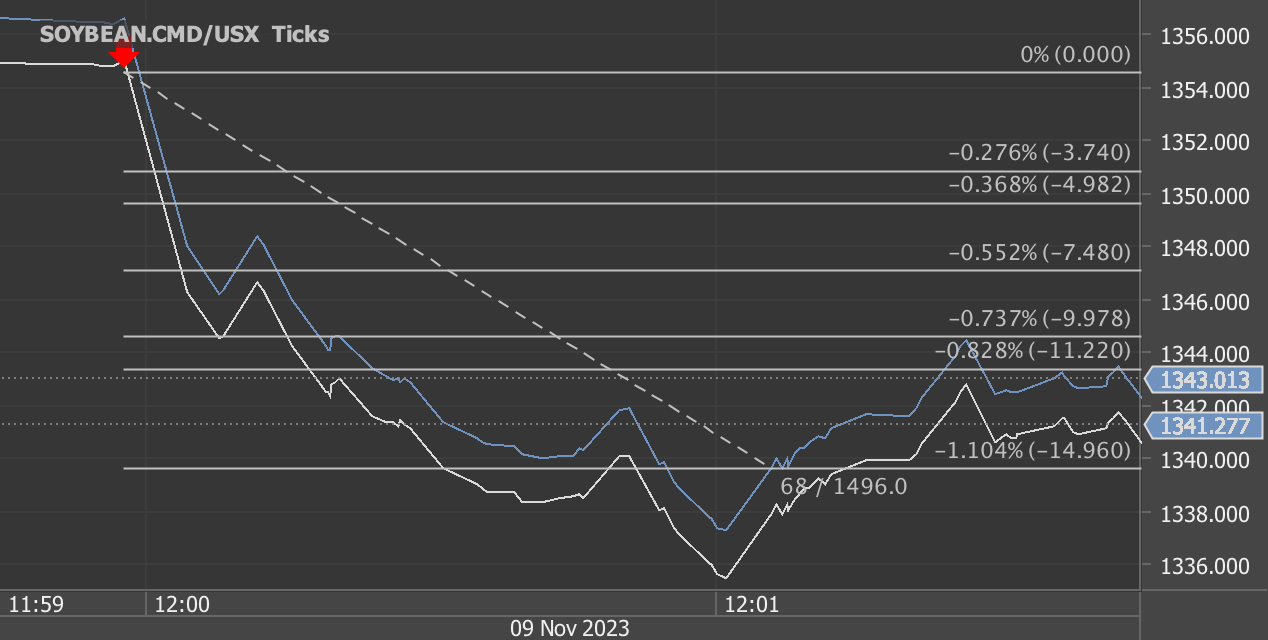
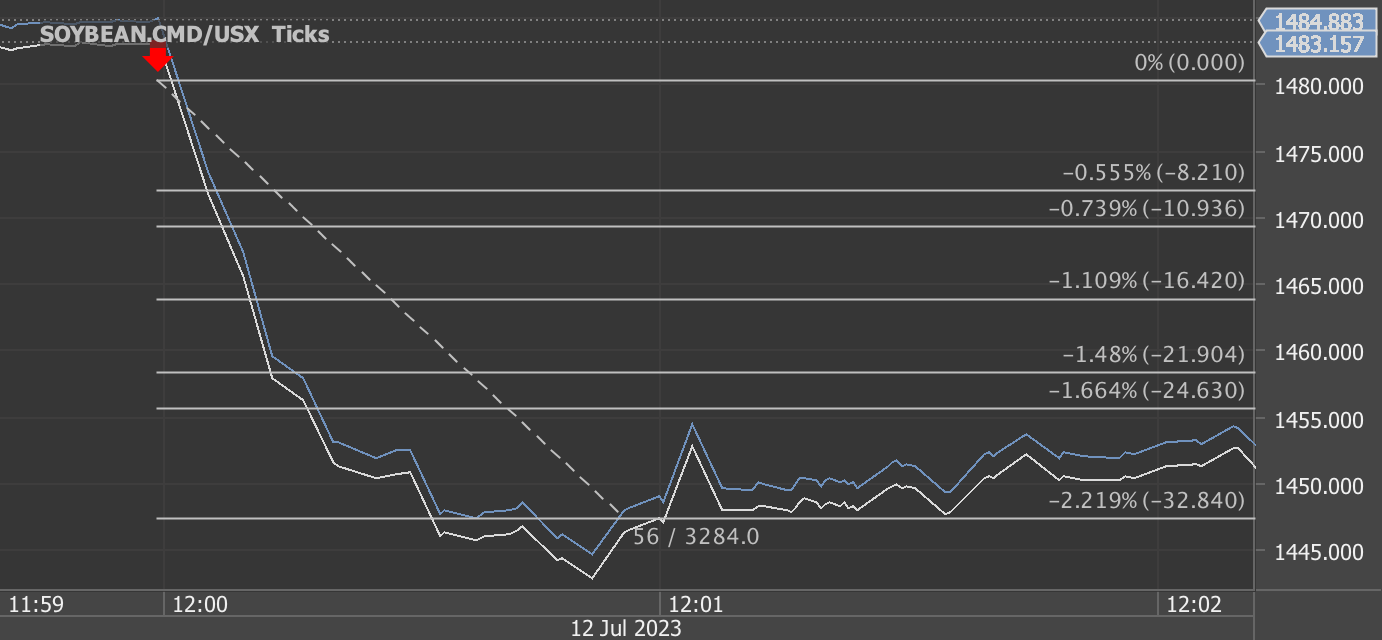
According to our analysis corn (ZC) and wheat (WC) futures prices moved around 40 ticks (24 ticks and 16 ticks) on USDA WASDE (World Agricultural Supply and Demand Estimates) data on 11 February 2025.


WASDE February 2025: Market Insights for Agricultural Traders

The latest World Agricultural Supply and Demand Estimates (WASDE) report, released on February 11, 2025, provides key insights into global agricultural markets. With adjustments in supply, demand, and pricing across major commodities, traders should pay close attention to shifting trends in wheat, corn, rice, soybeans, and livestock.

Wheat Market: Lower Ending Stocks, Price Holds

The U.S. wheat outlook for 2024/25 reflects higher domestic use and lower ending stocks, which fell by 4 million bushels to 794 million. Despite this decline, stocks remain 14% above last year’s levels. The season-average farm price remains unchanged at $5.55 per bushel. Globally, wheat supplies increased slightly due to higher production in Kazakhstan and Argentina. However, world trade declined by 3.0 million tons due to reduced exports from the EU, Mexico, Russia, Turkey, and Ukraine. China’s wheat imports were significantly cut to 8.0 million tons—the lowest in five years.

Traders saw wheat futures decline by 16 ticks following the report, likely reflecting expectations of robust U.S. stocks and weaker global trade.

Corn Market: No Change in U.S. Outlook, Lower Global Production

The U.S. corn supply and use outlook remained unchanged this month, but the projected season-average farm price was raised by 10 cents to $4.35 per bushel. Globally, coarse grain production was forecasted 1.8 million tons lower, mainly due to yield losses in Argentina and Brazil caused by heat and dryness. With reduced production and smaller exports from Brazil, Ukraine, and South Africa, corn imports for China were also cut. Global ending stocks dropped to 290.3 million tons, a decrease of 3.0 million.

Corn futures fell by 24 ticks, as traders responded to the lowered global production outlook, offset by the lack of significant changes in U.S. supply and demand.

Rice: Rising Imports and Stocks, Price Drops

The U.S. rice market saw increased supplies due to higher imports, with long-grain imports rising while medium- and short-grain imports declined. Domestic use hit a record 166.0 million cwt, while exports fell by 4.0 million cwt. Ending stocks climbed 18% year-over-year to 47.0 million cwt—the highest in a decade. The season-average farm price dropped by $0.20 per cwt to $15.40.

Globally, rice supplies dipped slightly due to a production decline in Sri Lanka, while consumption and trade increased. India’s exports were raised to a near-record 22.0 million tons. Ending stocks fell by 0.5 million tons, mainly due to reductions in India and Sri Lanka.

Soybeans: Lower Global Stocks, U.S. Price Down

While the U.S. soybean balance sheet remained unchanged, the season-average price dropped by 10 cents to $10.10 per bushel. Global soybean production fell, particularly in Argentina and Paraguay, due to persistent heat and dryness. Brazilian production remained at 169.0 million tons, with strong performance in the Center-West offsetting losses in the south. Global soybean ending stocks declined by 4.0 million tons, primarily due to reductions in Argentina and Brazil.

Livestock and Dairy: Production Adjustments and Price Revisions

  • Beef: Increased U.S. production expectations led to higher export forecasts, supported by strong global demand. Cattle prices rose across all quarters.

  • Pork: Production was raised, but exports were lowered due to slower demand in key markets.

  • Poultry: Broiler and turkey production faced downward revisions due to Highly Pathogenic Avian Influenza (HPAI)-related culling.

  • Eggs: Lower production forecasts due to HPAI-related flock reductions pushed prices higher.

  • Dairy: Lower milk production forecasts resulted in tighter domestic supplies, while the all-milk price forecast was revised slightly down to $22.60 per cwt.

Cotton: Minimal Adjustments, Lower Farm Price

The U.S. cotton balance sheet saw minor changes, with domestic mill use lowered and ending stocks increased. The season-average upland farm price was reduced to 63.5 cents per pound. Global cotton production rose, largely due to a 1-million-bale increase in China’s crop, while consumption and trade saw nominal changes.

Key Takeaways for Traders:

  • Bearish Corn & Wheat Futures: Declines of 24 and 16 ticks, respectively, indicate market responses to global production trends and stock adjustments.

  • Soybean Prices Under Pressure: Lower global stocks suggest tight supplies, but weaker price action indicates concerns over demand.

  • Rice & Sugar Trends: Higher rice stocks could keep prices under pressure, while sugar market adjustments reflect shifting trade flows.

  • Livestock & Dairy: Price movements across cattle, hogs, and dairy suggest volatility tied to supply constraints and trade dynamics.

Final Thoughts

This WASDE report highlights the importance of monitoring weather-driven production risks, shifting trade flows, and evolving demand trends. With notable changes in global stocks and trade, traders should stay alert to potential market shifts in the coming months.

For those in the agricultural markets, the February 2025 WASDE offers both opportunities and risks. Stay informed, manage your positions wisely, and watch for further developments in weather, policy changes, and global demand trends.

Disclaimer: This blog post is for informational purposes only and should not be construed as financial advice. Always conduct thorough research and consider seeking advice from a financial professional before making any investment decisions.

Source: https://www.usda.gov/oce/commodity/wasde/wasde0225.pdf


Haawks G4A is one of the fastest machine-readable data feeds for USDA data. We are beating big names in the industry by seconds. Coverage includes monthly USDA WASDE (World Agricultural Supply and Demand Estimates), quarterly USDA Grain Stocks and yearly USDA Prospective Plantings and USDA Acreage.

Please let us know your feedback. If you are interested in timestamps, please send us an email to sales@haawks.com.

Comment

104 ticks potential profit on 10 January 2025, analysis on trading soybeans, corn and wheat futures on USDA WASDE and USDA Grain Stocks data

Comment

104 ticks potential profit on 10 January 2025, analysis on trading soybeans, corn and wheat futures on USDA WASDE and USDA Grain Stocks data

According to our analysis soybeans (ZS), corn (ZC) and wheat (WC) futures prices moved around 104 ticks (36 ticks, 40 ticks and 28 ticks) on USDA WASDE (World Agricultural Supply and Demand Estimates) and USDA Grain Stocks data on 10 January 2025.

Soybeans (36 ticks)

Charts are exported from JForex (Dukascopy).


January 2025 WASDE and Grain Stocks Report: Key Takeaways for Agricultural Traders

The USDA’s World Agricultural Supply and Demand Estimates (WASDE - 656) and Grain Stocks Report released on January 10, 2025 provide a comprehensive update on the supply, demand, and stock levels for key commodities. For traders, these reports offer essential insights into potential price movements and market dynamics in the months ahead.

Below is a detailed breakdown of the key highlights for cotton, corn, soybeans, and wheat, covering both U.S. and global markets.

1. Cotton: Bearish Signals from Higher Stocks and Lower Prices

  • U.S. Cotton Outlook:

    • Production: Increased by 159,000 bales to 14.4 million bales, driven by higher yields (836 pounds/harvested acre) despite reduced harvested area in the Southwest.

    • Exports: Lowered by 300,000 bales to 11.0 million bales.

    • Ending Stocks: Increased to 4.8 million bales, pushing the stocks-to-use ratio to 38%.

    • Farm Price: Reduced to 65 cents per pound, reflecting ample supply and reduced export demand.

  • Global Cotton Market:

    • Production: Raised by 2 million bales to 119.4 million bales, primarily due to a 1.8 million-bale increase in China.

    • Consumption: Increased by 100,000 bales, driven by Bangladesh and Vietnam.

    • Trade: Global exports are up 225,000 bales, as gains in Brazil, Australia, and India offset the reduction in U.S. exports.

    • Ending Stocks: Increased by 1.9 million bales, with notable increases in China, Australia, and India.

💡 Trading Takeaway:
The cotton market presents bearish signals as higher global production and U.S. export cuts weigh on prices. Traders should monitor Southeast Asian demand closely and assess the potential impact of China’s stockpiling strategy.

2. Corn: Tighter Supplies Signal Price Support

U.S. Corn Outlook (WASDE):

  • Production: Cut to 14.9 billion bushels (-276 million bushels), reflecting a yield reduction to 179.3 bushels/acre (-3.8 bushels/acre).

  • Use:

    • Feed & Residual: Reduced by 50 million bushels to 5.8 billion bushels, due to lower-than-expected feed demand.

    • Exports: Lowered by 25 million bushels to 2.5 billion bushels.

  • Ending Stocks: Reduced by 198 million bushels to 1.88 billion bushels.

  • Farm Price: Increased to $4.25 per bushel (+$0.15), reflecting tighter supplies.

Grain Stocks Report (Corn):

  • Total Corn Stocks (Dec 1, 2024): 12.1 billion bushels (-1% year-over-year).

    • On-Farm Stocks: 7.66 billion bushels (-2%).

    • Off-Farm Stocks: 4.41 billion bushels (+2%).

  • Disappearance (Sep-Nov 2024): 4.56 billion bushels, slightly above the 4.53 billion bushels reported for the same period in 2023.

Global Corn Market:

  • Production: Lowered by 4.8 million tons to 1.494 billion tons, though China’s record harvest (294.9 million tons) offsets some global losses.

  • Trade: Global exports declined due to reductions in U.S. and Brazilian shipments.

  • Ending Stocks: Lowered by 3.1 million tons to 293.3 million tons, with China increasing its reserves to a record level.

💡 Trading Takeaway:
Corn prices could remain firm due to tightening U.S. supplies and strong domestic feed demand. The market will closely watch Brazil’s export pace and China’s reserve strategy as key determinants of price direction.

3. Soybeans: Higher Stocks with Strong Seasonal Demand

Grain Stocks Report (Soybeans):

  • Total Soybean Stocks (Dec 1, 2024): 3.10 billion bushels (+3% year-over-year).

    • On-Farm Stocks: 1.54 billion bushels (+6%).

    • Off-Farm Stocks: 1.56 billion bushels (+1%).

  • Disappearance (Sep-Nov 2024): 1.61 billion bushels, up 13% from the same period in 2023, reflecting stronger seasonal demand.

U.S. Soybean Outlook (WASDE):

While soybeans were not specifically highlighted in the WASDE production changes, the robust disappearance from the Grain Stocks Report signals sustained demand, especially for exports and domestic processing.

💡 Trading Takeaway:
The combination of rising stocks and strong disappearance could lead to price fluctuations. Traders should closely watch South American harvest updates and any geopolitical developments that could influence export markets.

4. Wheat: Rising Stocks Amid Strong Demand

U.S. Wheat Outlook (WASDE):

  • Supplies: Increased by 5 million bushels to 130 million bushels, driven by higher imports of Hard Red Spring wheat.

  • Domestic Use:

    • Feed & Residual Use: Unchanged at 120 million bushels.

    • Seed Use: Increased by 2 million bushels to 64 million bushels.

  • Exports: Steady at 850 million bushels despite by-class adjustments.

  • Ending Stocks: Raised by 3 million bushels to 798 million bushels (+15% year-over-year).

  • Farm Price: Reduced by $0.05 to $5.55 per bushel.

Grain Stocks Report (Wheat):

  • Total Wheat Stocks (Dec 1, 2024): 1.57 billion bushels (+10% year-over-year).

    • On-Farm Stocks: 467 million bushels (+16%).

    • Off-Farm Stocks: 1.10 billion bushels (+8%).

  • Disappearance (Sep-Nov 2024): 423 million bushels, up 22% from the same period in 2023, reflecting robust demand.

Global Wheat Market:

  • Supplies: Raised by 0.4 million tons to 1,060.7 million tons, with gains in Syria and Pakistan offsetting reductions in Uruguay.

  • Consumption: Lowered by 0.6 million tons, with Turkey’s demand decrease partially offset by increased usage in Ukraine.

  • Trade: Global exports are down 1.7 million tons due to reduced shipments from Russia and Ukraine.

  • Ending Stocks: Increased by 0.9 million tons to 258.8 million tons, with increases in Russia, Brazil, and Ukraine offsetting declines in China and Indonesia.

💡 Trading Takeaway:
The wheat market remains mixed. While U.S. imports and global stocks are rising, strong domestic demand and geopolitical tensions in the Black Sea region could continue to influence prices. Traders should watch for export developments and changes in demand from key buyers like Turkey and China.

Key Summary for Traders:

Commodity     U.S. Supply Trend     Global Supply Trend     Market Sentiment    
Cotton Higher stocks Rising global production Bearish
Corn Lower production Slight stock decline Bullish
Soybeans Higher stocks Strong demand Mixed
Wheat Increased imports Higher global stocks Mixed

Final Thoughts:

Agricultural markets are bracing for potential price volatility as the WASDE and Grain Stocks reports highlight key supply and demand shifts. Key areas to watch include:

  1. Cotton: Price pressure remains due to higher global production and reduced U.S. exports.

  2. Corn: Tighter U.S. supplies and robust feed demand could support prices.

  3. Soybeans: Despite higher stocks, strong seasonal demand may limit bearish movements.

  4. Wheat: Strong demand contrasts with rising stocks, creating a mixed outlook sensitive to geopolitical risks.

Traders should remain alert to any new developments, particularly weather conditions in South America, policy changes in China, and ongoing geopolitical tensions, as these could significantly impact commodity prices in the coming months.

Disclaimer: This blog post is for informational purposes only and should not be construed as financial advice. Always conduct thorough research and consider seeking advice from a financial professional before making any investment decisions.

Source: https://www.usda.gov/oce/commodity/wasde/wasde0125.pdf, https://downloads.usda.library.cornell.edu/usda-esmis/files/xg94hp534/5d86qt759/xp68nc84m/grst0125.pdf


Haawks G4A is one of the fastest machine-readable data feeds for USDA data. We are beating big names in the industry by seconds. Coverage includes monthly USDA WASDE (World Agricultural Supply and Demand Estimates), quarterly USDA Grain Stocks and yearly USDA Prospective Plantings and USDA Acreage.

Please let us know your feedback. If you are interested in timestamps, please send us an email to sales@haawks.com.

Comment

40 ticks potential profit on 12 July 2024, analysis on trading corn futures on USDA WASDE data

Comment

40 ticks potential profit on 12 July 2024, analysis on trading corn futures on USDA WASDE data

According to our analysis corn (ZC) futures prices moved around 40 ticks on USDA WASDE (World Agricultural Supply and Demand Estimates) and USDA Grain Stocks data on 12 July 2024.


The JULY WASDE Report: Implications for Global Agriculture Markets

The recently released World Agricultural Supply and Demand Estimates (WASDE) report for July 2024 provides crucial insights into the agricultural sector, forecasting trends for commodities like wheat, coarse grains, and oilseeds. These projections not only shape farming strategies but also have significant implications for traders, policymakers, and global markets. Let's delve into the key points from the report and their potential impact.

Wheat: Surplus Production with Lower Prices

The 2024/25 outlook for U.S. wheat indicates an increase in supplies, exports, and ending stocks. Production is expected to rise substantially, with all wheat production increasing by 134 million bushels to 2,008 million. This increase is attributed to larger harvested areas and higher yields, with significant rises noted in both spring wheat and winter wheat production.

Globally, the wheat supply is set to increase by 6.9 million tons, driven by higher production in the United States, Pakistan, and Canada. Pakistan’s wheat production is forecasted to reach a record 31.4 million tons. This surplus in production is likely to push down prices; the season-average farm price for wheat is projected to decrease by $0.80 per bushel to $5.70.

Coarse Grains: Corn Leads with Strong Production

The U.S. corn market is also looking robust with projections indicating larger supplies and increased domestic use and exports, although ending stocks are slightly lower. Corn production is expected to rise by 240 million bushels, with total use increasing by 100 million bushels due to greater feed and residual use and exports. This is likely to decrease the season-average farm price by 10 cents to $4.30 per bushel.

On the international front, the coarse grain outlook is mixed, with reductions in foreign corn production in the EU, Canada, and Russia due to challenging weather conditions. However, global corn exports for 2024/25 have shifted, favoring the United States, while imports are up for Canada and Mexico.

Oilseeds: A Slight Downturn with a Steady Outlook

The U.S. oilseed production for 2024/25 is projected at 131.5 million tons, with minor adjustments across various seeds. Soybean production is down by 15 million bushels due to a lower harvested area, which might lead to a slight decrease in ending stocks. The season-average soybean price is forecasted at $11.10 per bushel, a slight decrease from previous estimates.

Globally, soybean stocks are slightly down by 0.1 million tons, with notable decreases in Argentina, Brazil, and the EU. This is contrasted by increased soybean imports for China, suggesting a larger demand within the Asian markets.

Market Implications and Strategic Moves

  • Farmers and Agricultural Producers: The increased production in both wheat and corn suggests that farmers might benefit from expanding their acreage or investing in technologies to enhance yield. However, they must also prepare for potential price drops due to higher supply.

  • Traders and Investors: The shifts in global supply and demand provide trading opportunities, particularly in commodities with significant changes in stock levels or production forecasts. Diversifying portfolios to include commodities with expected price increases or stable markets could be beneficial.

  • Policymakers and Economic Planners: Ensuring stability in local markets despite global fluctuations will be crucial. Policies aimed at supporting domestic agriculture during times of excess global supply could help mitigate adverse effects on local farmers.

Conclusion

The July WASDE report paints a complex picture of the global agricultural landscape, characterized by increased production and varying market dynamics across different commodities. Stakeholders across the spectrum, from farmers to policymakers, must stay informed and agile to navigate these changes effectively. As always, the key to success in agriculture lies in strategic planning and adaptability to ever-changing market conditions.

Source: https://www.usda.gov/oce/commodity/wasde/wasde0724.pdf


Haawks G4A is one of the fastest machine-readable data feeds for USDA data. We are beating big names in the industry by seconds. Coverage includes monthly USDA WASDE (World Agricultural Supply and Demand Estimates), quarterly USDA Grain Stocks and yearly USDA Prospective Plantings and USDA Acreage.

Please let us know your feedback. If you are interested in timestamps, please send us an email to sales@haawks.com.

Comment

48 ticks potential profit on 12 January 2024, analysis on trading soybeans futures on USDA WASDE and USDA Grain Stocks data

Comment

48 ticks potential profit on 12 January 2024, analysis on trading soybeans futures on USDA WASDE and USDA Grain Stocks data

According to our analysis soybeans (ZS) futures prices moved around 48 ticks on USDA WASDE (World Agricultural Supply and Demand Estimates) and USDA Grain Stocks data on 12 January 2024.

Soybeans (48 ticks)

Charts are exported from JForex (Dukascopy).


WASDE Report (January 2024) - Key Highlights:

  • Wheat: U.S. wheat ending stocks lowered due to decreased supplies, offset by less use. Global wheat outlook shows increased supplies, consumption, trade, and ending stocks.

  • Corn: U.S. corn production at a record high, leading to greater production and higher ending stocks. Globally, coarse grain production is forecasted to increase.

  • Rice: Slightly higher U.S. rice supplies and higher ending stocks. Globally, a decrease in supplies, consumption, trade, and ending stocks.

  • Oilseeds: U.S. oilseed production up, led by increases in soybean, rapeseed, and sunflowerseed crops. Global soybean production slightly raised.

  • Sugar: Mexico's sugar production projected lower. U.S. sugar supply increased due to higher production and imports.

  • Livestock, Poultry, and Dairy: Increased production in beef, pork, and broiler for 2023. Adjustments in exports and imports across various animal products.

  • Cotton: U.S. cotton forecasts show lower production, exports, and ending stocks. Globally, ending stocks are forecasted higher.

NASS Corn, Soybean, and Wheat Stocks Report (as of December 1, 2023):

  • Corn Stocks: Total of 12.2 billion bushels, up 13% from the previous year. On-farm stocks increased by 16%, and off-farm stocks up by 7%.

  • Soybean Stocks: Total of 3.00 billion bushels, down 1% from the previous year. On-farm stocks decreased by 2%, while off-farm stocks slightly increased.

  • Wheat Stocks: Total of 1.41 billion bushels, up 8% from the previous year. On-farm stocks increased by 9%, and off-farm stocks rose by 7%.

These reports provide a comprehensive overview of the current state and projections for key agricultural commodities in the U.S., including their production, stocks, and expected market dynamics. The WASDE report's insights are crucial for global agricultural markets, while the NASS stock data specifically informs about the domestic supply levels of corn, soybeans, and wheat. Both sets of information are essential for market analysts, policymakers, and stakeholders in the agricultural sector for informed decision-making and market analysis.

Source: https://www.usda.gov/oce/commodity/wasde/wasde0124.pdf, https://downloads.usda.library.cornell.edu/usda-esmis/files/xg94hp534/vd66xk611/4m90gh16q/grst0124.pdf


Haawks G4A is one of the fastest machine-readable data feeds for USDA data. We are beating big names in the industry by seconds. Coverage includes monthly USDA WASDE (World Agricultural Supply and Demand Estimates), quarterly USDA Grain Stocks and yearly USDA Prospective Plantings and USDA Acreage.

Please let us know your feedback. If you are interested in timestamps, please send us an email to sales@haawks.com.

Comment

76 ticks potential profit on 9 November 2023, analysis on trading soybeans and corn futures on USDA WASDE data

Comment

76 ticks potential profit on 9 November 2023, analysis on trading soybeans and corn futures on USDA WASDE data

According to our analysis soybeans (ZS) and corn (ZC) futures prices moved around 76 ticks on USDA WASDE (World Agricultural Supply and Demand Estimates) data on 9 November 2023.

Soybeans (56 ticks)

Charts are exported from JForex (Dukascopy).


The October 2023 World Agricultural Supply and Demand Estimates (WASDE) report presents a comprehensive overview of various key agricultural sectors, both domestically in the United States and globally. Here are the highlights of the report along with additional information on market movements:

Wheat & Coarse Grains:

  • U.S. Wheat: Shows increased supplies, higher domestic use, and ending stocks due to augmented production.

  • Global Wheat: Indicates reduced supplies, consumption, trade, and stocks due to varied production changes across countries.

  • U.S. Corn: Forecasts decreased supplies, exports, and ending stocks because of reduced production and demand.

  • Global Coarse Grains: Reflects mixed production changes affecting trade and stocks across different countries.

Rice & Oilseeds:

  • U.S. Rice: Predicts slightly reduced supplies with increased exports. Global trade and supplies fluctuate slightly.

  • U.S. Oilseeds (Soybeans): Forecasts reduced production, impacting exports and supplies. Global oilseed production changes differ across nations, affecting trade and stocks.

Sugar, Livestock, Poultry, and Dairy:

  • Sugar: Reports supply changes in Mexico and the U.S., influenced by factors such as drought.

  • Livestock, Poultry, Dairy: Demonstrates adjustments in production, exports, imports, and price forecasts driven by factors like demand, market competition, and supply variations.

Cotton and Global Outlook:

  • Cotton: Forecasts lower U.S. production, exports, and ending stocks. Globally, changes in production and trade in various countries impact the overall market scenario.

Additionally, we noticed the following market movements:

  • Soybean Futures: Experienced a 56-tick downward movement, possibly in response to reduced U.S. soybean production and increased competition from South America.

  • Corn Futures: Witnessed a 20-tick decline, likely due to decreased U.S. corn production, slow early-season demand, and lower feed and residual use, as outlined in the report.

The market reaction was mixed, as reflected in the fluctuations across various commodities, indicating a complex interplay of supply, demand, and global factors. These adjustments hold implications for traders, investors, and policymakers, guiding them in making informed decisions within the dynamic agricultural landscape.

Source: https://www.usda.gov/oce/commodity/wasde


Haawks G4A is one of the fastest machine-readable data feeds for USDA data. We are beating big names in the industry by seconds. Coverage includes monthly USDA WASDE (World Agricultural Supply and Demand Estimates), quarterly USDA Grain Stocks and yearly USDA Prospective Plantings and USDA Acreage.

Please let us know your feedback. If you are interested in timestamps, please send us an email to sales@haawks.com.

Comment

84 ticks potential profit on 12 October 2023, analysis on trading soybeans futures on USDA WASDE data

Comment

84 ticks potential profit on 12 October 2023, analysis on trading soybeans futures on USDA WASDE data

According to our analysis soybeans (ZS) futures prices moved around 84 ticks on USDA WASDE (World Agricultural Supply and Demand Estimates) data on 12 October 2023.

Soybeans (84 ticks)

Charts are exported from JForex (Dukascopy).


World Agricultural Supply and Demand Estimates (WASDE) - October 2023

WHEAT: The WASDE report for October 2023 provides insights into the U.S. wheat outlook for the 2023/24 season. It anticipates increased supplies, higher domestic use, unchanged exports, and elevated ending stocks. Key points include higher production, primarily based on data from the NASS Small Grains Annual Summary. Domestic use has risen, specifically in feed and residual use. Despite unchanged exports at 700 million bushels, ending stocks have surged, impacting the season-average farm price.

COARSE GRAINS: The report outlines a U.S. corn outlook for 2023/24 characterized by reduced supplies, lower feed and residual use, exports, and smaller ending stocks. Corn production and supply estimates are down due to lower yields and beginning stocks. Exports have also decreased, primarily due to a drop in early-season demand. Consequently, corn ending stocks for 2023/24 have fallen. The season-average corn price received by producers increased, reflecting these changes. Globally, coarse grain production is reduced, but foreign production, trade, and stocks see marginal increases.

OILSEEDS: The report forecasts reduced U.S. oilseed production for 2023/24, primarily affecting soybeans, cottonseed, peanuts, rapeseed, and sunflower seeds. Soybean production has decreased due to lower yields, affecting supplies and exports, with soybean meal and oil prices remaining unchanged. Foreign oilseed production has also been lowered, with notable reductions in soybean and peanut output in India and canola production in Canada.

COTTON: The 2023/24 U.S. cotton supply and demand estimates indicate lower production, exports, and ending stocks. Reduced yields in Texas are the main reason for the decrease in production, and ending stocks have been cut by 200,000 bales. Despite these changes, the season-average price for upland cotton is projected to remain stable. The global cotton balance sheet sees a significant reduction in beginning stocks due to accounting changes for Brazil. Additional production changes include increases in crop estimates for Brazil, Argentina, and Tanzania, offset by reductions in the United States, Australia, and Greece. Overall, global cotton consumption and trade remain relatively unchanged.

The WASDE report provides crucial insights into the agricultural supply and demand dynamics, enabling stakeholders to make informed decisions in the ever-evolving global market.

Source: https://www.usda.gov/oce/commodity/wasde


Haawks G4A is the fastest machine-readable data feed for USDA data. We are beating big names in the industry by seconds. Coverage includes monthly USDA WASDE (World Agricultural Supply and Demand Estimates), quarterly USDA Grain Stocks and yearly USDA Prospective Plantings and USDA Acreage.

Please let us know your feedback. If you are interested in timestamps, please send us an email to sales@haawks.com.

Comment

36 ticks potential profit on 29 September 2023, analysis on trading soybeans futures on USDA Grain Stocks data

Comment

36 ticks potential profit on 29 September 2023, analysis on trading soybeans futures on USDA Grain Stocks data

According to our analysis soybeans (ZS) futures prices moved around 36 ticks on USDA Grain Stocks data on 29 September 2023.

Soybeans (36 ticks)

Charts are exported from JForex (Dukascopy).


In the USDA Grain Stocks report dated September 29, 2023, the following key information is highlighted:

Corn Stocks:

  • Old crop corn stocks as of September 1, 2023, amounted to 1.36 billion bushels, down 1 percent from the same date in the previous year.

  • On-farm stocks increased by 19 percent compared to the previous year, totaling 605 million bushels, while off-farm stocks decreased by 13 percent to 756 million bushels.

  • Indicated disappearance for June - August 2023 was 2.75 billion bushels, lower than the previous year.

  • The 2022 corn production was revised down by 15.0 million bushels, with adjustments to planted area, harvested area, yield, and production.

Soybean Stocks:

  • Old crop soybean stocks as of September 1, 2023, totaled 268 million bushels, down 2 percent from the previous year.

  • On-farm stocks increased by 14 percent to 72.0 million bushels, while off-farm stocks decreased by 7 percent to 196 million bushels.

  • Indicated disappearance for June - August 2023 was 528 million bushels, down 24 percent from the previous year.

  • The 2022 soybean production was revised down by 5.93 million bushels, with adjustments to harvested area, yield, and production.

All Wheat Stocks:

  • All wheat stored in all positions on September 1, 2023, totaled 1.78 billion bushels, a slight increase from the previous year.

  • On-farm stocks increased by 1 percent to 598 million bushels, while off-farm stocks decreased by less than 1 percent to 1.18 billion bushels.

  • Indicated disappearance for June - August 2023 was 614 million bushels, up 8 percent from the previous year.

A special note emphasizes that the marketing year for corn and soybeans has concluded, leading to a review of the balance sheet and revisions in acreage, yield, and production for the 2022 crop. These statistics provide valuable insights into stock levels and production changes for corn, soybeans, and wheat, crucial for agricultural planning and market analysis.

Source: https://downloads.usda.library.cornell.edu/usda-esmis/files/xg94hp534/ww72cv37d/3j334m45p/grst0923.pdf


Haawks G4A is the fastest machine-readable data feed for USDA data. We are beating big names in the industry by seconds. Coverage includes monthly USDA WASDE (World Agricultural Supply and Demand Estimates), quarterly USDA Grain Stocks and yearly USDA Prospective Plantings and USDA Acreage.

Please let us know your feedback. If you are interested in timestamps, please send us an email to sales@haawks.com.

Comment

44 ticks potential profit on 12 September 2023, analysis on trading soybeans futures on USDA WASDE data

Comment

44 ticks potential profit on 12 September 2023, analysis on trading soybeans futures on USDA WASDE data

According to our analysis soybeans (ZS) futures prices moved around 44 ticks on USDA WASDE (World Agricultural Supply and Demand Estimates) data on 12 September 2023.

Soybeans (44 ticks)

Charts are exported from JForex (Dukascopy).


The World Agricultural Supply and Demand Estimates (WASDE) report for September 12, 2023, offers the following key insights:

Wheat:

  • The U.S. wheat supply and use outlook for 2023/24 remains unchanged, with a projected season-average farm price of $7.50 per bushel.

  • Globally, wheat supplies, consumption, exports, and ending stocks have decreased compared to the previous month, marking the first year-to-year decline in global wheat production since 2018/19.

  • Major wheat-producing countries, including Australia and Canada, are experiencing decreased production due to adverse weather conditions.

Coarse Grains (Corn):

  • The U.S. corn outlook for 2023/24 anticipates slightly larger supplies and ending stocks, with corn production forecasted at 15.1 billion bushels.

  • Global coarse grain production shows marginal changes, with variations in trade and increased stocks.

  • Foreign corn production remains stable, with Ukraine's production showing an increase and the EU experiencing a slight decline.

  • Major global trade changes include reduced barley exports for Canada and increased exports for Russia.

  • Foreign corn ending stocks have risen, particularly in Brazil, Mexico, Ukraine, and China, offsetting a decline in Argentina.

  • World corn ending stocks have increased relative to the previous month.

Oilseeds (Soybeans):

  • U.S. soybean supply and use changes for 2023/24 include lower beginning stocks, production, crush, exports, and ending stocks.

  • Reduced beginning stocks reflect increased exports in the previous year.

  • Soybean production is projected at 4.1 billion bushels, with a lower yield offset by higher harvested area.

  • The soybean crush and export forecasts have been reduced due to lower supplies, resulting in decreased ending stocks.

  • The U.S. season-average soybean price is forecasted to be $12.90 per bushel.

  • Global oilseed production for 2023/24 has decreased, primarily due to lower rapeseed, sunflowerseed, and cottonseed production in various countries.

  • Global soybean crush and exports have also declined, with reduced crush expected in several major producing nations.

  • Import changes include decreased imports for Pakistan, Thailand, the EU, and Indonesia, while China's imports have increased due to higher crush demand and shipments from Brazil.

These insights from the September 12, 2023, WASDE report provide critical information for stakeholders in the wheat, coarse grains, and oilseeds markets, guiding their decision-making processes in the global agricultural landscape.

Source: https://www.usda.gov/oce/commodity/wasde


Haawks G4A is the fastest machine-readable data feed for USDA data. We are beating big names in the industry by seconds. Coverage includes monthly USDA WASDE (World Agricultural Supply and Demand Estimates), quarterly USDA Grain Stocks and yearly USDA Prospective Plantings and USDA Acreage.

Please let us know your feedback. If you are interested in timestamps, please send us an email to sales@haawks.com.

Comment

92 ticks potential profit on 11 August 2023, analysis on trading soybeans futures on USDA WASDE data

Comment

92 ticks potential profit on 11 August 2023, analysis on trading soybeans futures on USDA WASDE data

According to our analysis soybeans (ZS) futures prices moved around 92 ticks on USDA WASDE (World Agricultural Supply and Demand Estimates) data on 11 August 2023.

ZS 92 ticks

Haawks G4A is the fastest machine-readable data feed for USDA data. We are beating big names in the industry by seconds. Coverage includes monthly USDA WASDE (World Agricultural Supply and Demand Estimates), quarterly USDA Grain Stocks and yearly USDA Prospective Plantings and USDA Acreage.

Please let us know your feedback. If you are interested in timestamps, please send us an email to sales@haawks.com.

Soybeans (92 ticks)

Charts are exported from JForex (Dukascopy).

Comment

188 ticks potential profit on 12 July 2023, analysis on trading corn, wheat and soybeans futures on USDA WASDE data

Comment

188 ticks potential profit on 12 July 2023, analysis on trading corn, wheat and soybeans futures on USDA WASDE data

According to our analysis corn (ZC), wheat (ZW) and soybeans (ZS) futures prices moved around 188 ticks on USDA WASDE (World Agricultural Supply and Demand Estimates) data on 12 July 2023.

ZC 32 ticks, ZW 28 ticks, ZS 128 ticks

Haawks G4A is the fastest machine-readable data feed for USDA data. We are beating big names in the industry by seconds. Coverage includes monthly USDA WASDE (World Agricultural Supply and Demand Estimates), quarterly USDA Grain Stocks and yearly USDA Prospective Plantings and USDA Acreage.

Please let us know your feedback. If you are interested in timestamps, please send us an email to sales@haawks.com.

Soybeans (128 ticks)

Charts are exported from JForex (Dukascopy).

Comment