Viewing entries tagged
US CPI

Comment

23 pips, US30 147 points and BTC 1279 points potential profit in 32 seconds on 12 February 2025, analysis on futures forex fx low latency news trading USDJPY on US Consumer Price Index (CPI)

According to our analysis USDJPY moved 23 pips, US30 moved 147 points and Bitcoin (BTC) moved 1279 points on US BLS Consumer Price Index (CPI) data on 12 February 2025.
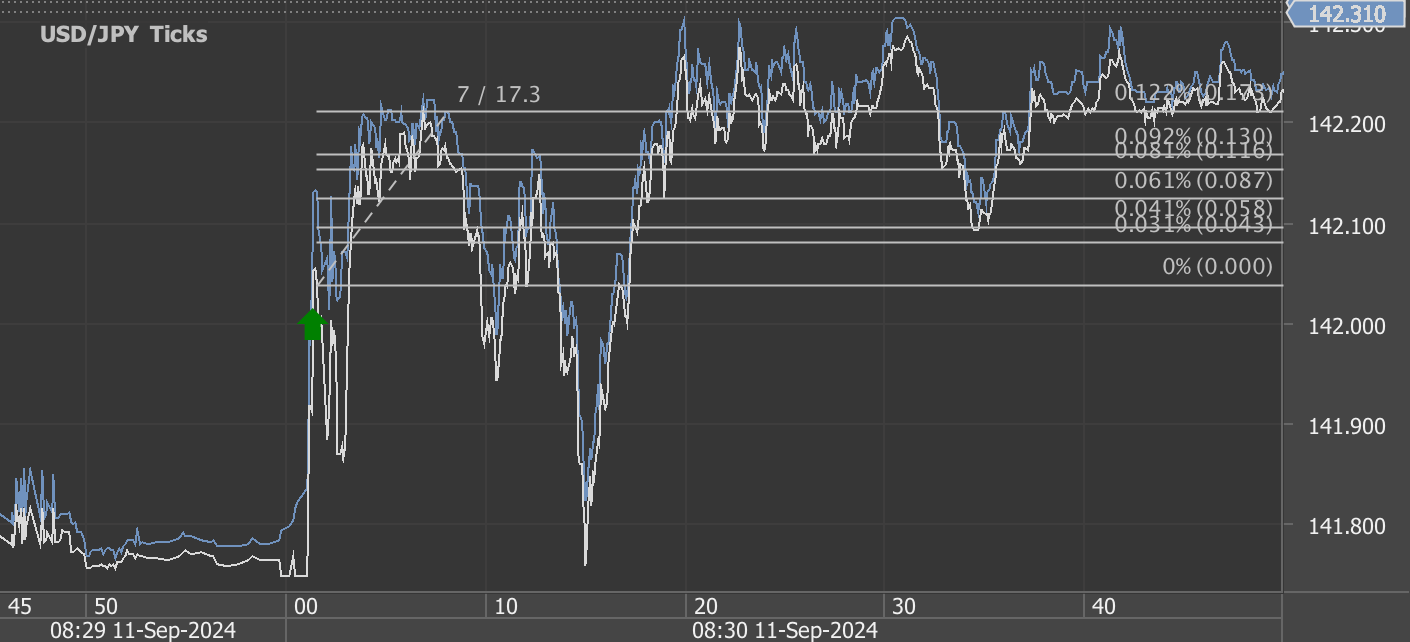
USDJPY (23 pips)

US30 (147 points)

Bitcoin BTC (1279 points)

Charts are exported from JForex (Dukascopy).


CPI Report Shakes Markets: USD/JPY Gains, US30 Drops, BTC Dips

The January 2025 Consumer Price Index (CPI) report released by the Bureau of Labor Statistics showed a higher-than-expected inflation increase of 0.5% month-over-month, bringing the annual CPI to 3.0%. This data immediately sent ripples through the financial markets, impacting major asset classes, including forex, equities, and crypto.

Key CPI Highlights:

  • Headline CPI: +0.5% (MoM), +3.0% (YoY)

  • Core CPI (Ex-Food & Energy): +0.4% (MoM), +3.3% (YoY)

  • Shelter Costs: +0.4% MoM, a major driver of inflation

  • Energy Index: +1.1% MoM, fueled by a 1.8% increase in gasoline prices

  • Food Index: +0.4% MoM, with food-at-home prices up 0.5%

Market Reaction:

Forex – USD/JPY Rises 23 Pips

The U.S. dollar strengthened against the Japanese yen, with USD/JPY climbing 23 pips post-release. This move reflects increased expectations that the Federal Reserve may need to maintain higher interest rates for longer to combat inflation. The resilience of core CPI above 3.0% further solidifies the Fed’s hawkish stance, making USD more attractive compared to JPY, which remains under the Bank of Japan’s ultra-loose policy.

Equities – US30 Drops 147 Points

Wall Street reacted negatively to the inflation data, with the Dow Jones Industrial Average (US30) falling 147 points. Investors are concerned that persistent inflation may delay any potential Fed rate cuts, dampening risk appetite. Additionally, rising costs for shelter and transportation services indicate that consumer spending power could take a hit, affecting corporate earnings.

Crypto – Bitcoin Drops 1,279 Points

Bitcoin (BTC) saw a sharp decline of 1,279 points following the CPI release, reflecting a risk-off sentiment in the broader market. Higher-than-expected inflation led to speculation that Fed policy will remain tight, reducing liquidity for riskier assets like crypto. BTC’s drop also aligns with a broader sell-off in tech and growth stocks, which tend to be more sensitive to interest rate outlooks.

Final Thoughts

Traders should brace for continued volatility as inflation concerns linger. The next major catalyst will be the Fed’s response in upcoming meetings and market reactions to any further economic data releases. Stay alert to potential breakout moves in USD/JPY, US30, and BTC as inflation trends develop.

Disclaimer: This blog post is for informational purposes only and should not be construed as financial advice. Always conduct thorough research and consider seeking advice from a financial professional before making any investment decisions.

Source: https://www.bls.gov/news.release/cpi.nr0.htm


Start futures forex fx news trading with Haawks G4A low latency machine-readable data, one of the fastest machine-readable news trading feed for US macro-economic and commodity data.

Please let us know your feedback. If you are interested in timestamps, please send us an email to sales@haawks.com.

Comment

Comment

25 pips, US30 90 points and BTC 1018 points potential profit in 40 seconds on 15 January 2025, analysis on futures forex fx low latency news trading USDJPY, EURUSD on US Consumer Price Index (CPI)

According to our analysis USDJPY and EURUSD moved 54 pips, US30 moved 90 points and Bitcoin (BTC) moved 1018 points on US BLS Consumer Price Index (CPI) data on 15 January 2025.

USDJPY (18 pips)

EURUSD (7 pips)

US30 (90 points)

Bitcoin BTC (1018 points)

Charts are exported from JForex (Dukascopy).


December 2024 CPI Report: Core Inflation Falls Short of Expectations – What It Means for Markets

The U.S. Bureau of Labor Statistics released the Consumer Price Index (CPI) for December 2024 on January 15, 2025. While headline inflation was in line with expectations, core inflation (excluding food and energy) came in slightly cooler than anticipated. The headline CPI rose 0.4% month-over-month and 2.9% year-over-year, meeting forecasts. However, core CPI increased by 0.2% month-over-month (vs. 0.3% expected) and 3.2% year-over-year (vs. 3.3% expected). Here’s a breakdown of the report and its implications for traders.

Headline Takeaways

  1. Headline Inflation: The all-items index rose 0.4% month-over-month and 2.9% year-over-year, reflecting steady inflationary pressures in energy and food prices.

  2. Core Inflation Misses: Core CPI rose 0.2% month-over-month, below the forecasted 0.3%. Year-over-year, core inflation moderated to 3.2%, also below the expected 3.3%.

  3. Energy Drives the Headline: Energy prices surged 2.6% month-over-month, with gasoline prices jumping 4.4%, making energy a key driver of the overall CPI increase.

  4. Food Inflation Holds Steady: Food prices rose 0.3% month-over-month, with both food at home and food away from home contributing equally to the increase.

Market Implications of Core CPI Miss

Cooling Core Inflation Trends

  • The 0.2% month-over-month rise in core CPI marked a modest cooling from the expected 0.3%. Year-over-year, the 3.2% core inflation rate signals gradual easing in underlying price pressures.

  • Market Impact: A softer-than-expected core reading could prompt markets to reassess the Federal Reserve’s policy stance, increasing the likelihood of a pause or easing cycle sooner than previously anticipated.

Energy Price Surge Shifts Focus

  • Energy prices rose significantly, with a 4.4% increase in gasoline prices dominating the report. However, on a year-over-year basis, energy remains a deflationary factor, down 0.5%.

  • Market Impact: Energy-driven headline inflation may not alter the Fed’s trajectory if core inflation continues to cool, but it could buoy commodity markets and inflation-sensitive sectors.

Sector Breakdown

Shelter Remains Elevated

  • Shelter costs rose 0.3% month-over-month and 4.6% year-over-year. Shelter remains the largest contributor to core inflation but showed signs of stabilization.

  • Implications for Traders: Persistent shelter inflation could limit the Fed’s flexibility, supporting higher-for-longer interest rate expectations.

Food Prices Steady but Mixed

  • Food at home (+0.3%) and food away from home (+0.3%) rose in tandem. Cereals and bakery products saw a sharp rise (+1.2%), while nonalcoholic beverages (-0.4%) and fruits and vegetables (-0.1%) declined.

  • Market Impact: Stable food inflation supports consumer purchasing power, benefiting consumer discretionary stocks.

Transportation and Autos Drive Core

  • Used cars and trucks rebounded with a 1.2% increase, while new vehicles rose 0.5%. Airline fares surged 3.9%.

  • Implications for Traders: Rising auto and transportation costs could impact consumer sentiment and provide short-term tailwinds to related industries.

Fed Policy Implications

With core CPI coming in below expectations, markets may interpret the data as a sign that inflation is moderating toward the Federal Reserve’s target. While headline inflation remains steady, the softer core reading could shift the Fed’s tone toward a more dovish stance, especially if cooling trends persist.

Trading Opportunities

  1. Equities: Growth stocks and rate-sensitive sectors may gain on expectations of a dovish Fed. Defensive sectors may face headwinds if inflation pressures ease.

  2. Bonds: Treasury yields could decline, particularly on the shorter end of the curve, as markets price in reduced rate hike probabilities.

  3. Commodities: Energy markets may rally due to the sharp increase in gasoline and natural gas prices. Gold could see gains if inflation expectations moderate.

  4. Forex: The U.S. Dollar Index (DXY) might weaken if traders anticipate a softer Fed policy path.

Disclaimer: This blog post is for informational purposes only and should not be construed as financial advice. Always conduct thorough research and consider seeking advice from a financial professional before making any investment decisions.

Source: https://www.bls.gov/news.release/cpi.nr0.htm


Start futures forex fx news trading with Haawks G4A low latency machine-readable data, one of the fastest machine-readable news trading feed for US macro-economic and commodity data.

Please let us know your feedback. If you are interested in timestamps, please send us an email to sales@haawks.com.

Comment

Comment

54 pips potential profit in 11 seconds on 13 November 2024, analysis on futures forex fx low latency news trading USDJPY and EURUSD on US BLS Consumer Price Index (CPI) data

According to our analysis USDJPY and EURUSD moved 54 pips on US BLS Consumer Price Index (CPI) data on 13 November 2024.

USDJPY (32 pips)

EURUSD (22 pips)

Charts are exported from JForex (Dukascopy).


October 2024 CPI Report: Key Highlights and Insights

Today’s Consumer Price Index (CPI) report from the Bureau of Labor Statistics reveals modest inflationary trends in October, showing a steady pace in prices with an overall increase of 0.2% for the month, consistent with the previous three months. This brings the year-over-year increase for all items to 2.6%, marking a slight acceleration from the 2.4% reported for September. Here’s a breakdown of the key drivers behind October’s CPI numbers and what it could mean for consumers and the economy.

Shelter Costs Remain a Key Driver of Inflation

Shelter costs, a substantial portion of the CPI, rose 0.4% in October. This increase accounted for more than half of the overall rise in the CPI for the month. Over the past 12 months, shelter costs have climbed by 4.9%, contributing significantly to the core inflation measure (all items less food and energy), which rose 3.3% year-over-year. Rent and owners’ equivalent rent both increased by 0.4% in October, reflecting the persistent upward pressure in housing costs.

Food Prices Continue to Climb, but at a Slower Pace

The food index increased by 0.2% in October, a slight slowdown from September’s 0.4% rise. Prices for food at home edged up 0.1%, with notable increases in cereals and bakery products (+1.0%) and dairy (+1.0%), as well as fruits and vegetables (+0.4%). However, the meats, poultry, fish, and eggs index fell 1.2%, driven by a sharp 6.4% decrease in egg prices. For food away from home, including restaurant meals, prices rose 0.2%. Over the past year, food prices have risen by 2.1%.

Energy Index Stays Flat After Recent Declines

Following a 1.9% decline in September, the energy index remained unchanged in October, bringing some stability after several months of fluctuation. Gasoline prices continued their decline with a 0.9% drop, contributing to the 12.2% decrease over the past year. Fuel oil also saw a notable reduction, with prices down by 20.8% over the last 12 months. However, the cost of electricity increased 1.2% for the month and has risen by 4.5% over the year, while natural gas increased by 0.3% in October, up 2.0% year-over-year.

Core CPI Sees Steady Growth, Driven by Services and Transportation

The core CPI, excluding the volatile food and energy sectors, rose by 0.3% in October. Services excluding energy increased 0.3% as well, with significant contributions from shelter and medical care. Used cars and trucks experienced a surprising uptick of 2.7% for the month, after several months of declines. Airline fares also jumped by 3.2%, and medical care services increased by 0.4%.

Apparel, Communication, and Household Furnishings Decline

While the prices of many items rose, some categories saw decreases. Apparel fell by 1.5% in October, following an increase in September, while communication and household furnishings indexes also experienced declines. These decreases helped to offset some of the monthly CPI gains, indicating some price variability across goods and services.

Annual Inflation and Outlook

The CPI report shows a steady 2.6% increase over the past 12 months, reflecting a measured but persistent inflationary environment. The energy index, which has been a source of relief with a 4.9% decrease over the year, helped balance the rise in shelter and other core costs. However, the uptick in core inflation, particularly from services and shelter, suggests ongoing challenges in keeping inflation within target levels.

Looking forward, the November CPI report, scheduled for December 11, will offer further insights into these trends. Key areas to watch will include the energy index, as seasonal adjustments for heating costs take effect, and shelter, which remains a major factor in inflation. The CPI data continues to be an essential gauge for understanding the economic pressures on consumers and will likely influence the Federal Reserve's monetary policy decisions in the coming months.

In Summary

October’s CPI data suggests a stable but gradually rising inflation environment, with shelter costs as the dominant force. Food prices continue to rise moderately, while energy costs remain volatile but stable for now. As inflation remains slightly above the Federal Reserve’s target, policymakers and consumers alike will be keeping a close eye on these trends heading into the winter months.

Stay tuned for our next update following the release of November’s CPI data, as we continue to track the evolving inflation landscape and its implications for everyday life and economic policy.

Source: https://www.bls.gov/news.release/cpi.nr0.htm


Start futures forex fx news trading with Haawks G4A low latency machine-readable data, one of the fastest machine-readable news trading feed for US macro-economic and commodity data.

Please let us know your feedback. If you are interested in timestamps, please send us an email to sales@haawks.com.

Comment

Comment

27 pips potential profit in 7 seconds on 11 September 2024, analysis on futures forex fx low latency news trading USDJPY and EURUSD on US BLS Consumer Price Index (CPI) data

According to our analysis USDJPY and EURUSD moved 27 pips on US BLS Consumer Price Index (CPI) data on 11 September 2024.

USDJPY (17 pips)

EURUSD (10 pips)

Charts are exported from JForex (Dukascopy).


Understanding the Latest CPI Data: Key Takeaways from August 2024

The Consumer Price Index (CPI) for August 2024 reveals subtle yet important trends in the U.S. economy. According to the U.S. Bureau of Labor Statistics, the CPI for All Urban Consumers (CPI-U) rose by 0.2 percent on a seasonally adjusted basis, maintaining the same rate of increase as observed in July. Over the past 12 months, the index recorded a 2.5 percent increase before seasonal adjustments, marking a relatively modest inflationary trend compared to previous years.

Breakdown of CPI Components:

  • Shelter: The cost of shelter continued to be a significant driver of the overall index, rising by 0.5 percent in August, thus contributing majorly to the broader index's movement.

  • Food: Food prices saw a slight increase of 0.1 percent, with food away from home experiencing a higher rise of 0.3 percent compared to food at home, which remained unchanged.

  • Energy: Contrasting these increases, the energy index fell by 0.8 percent, influenced by a significant drop in gasoline and fuel oil prices.

Year-over-Year Analysis:

  • General Index: The all-items index increased by 2.5 percent over the year, the smallest 12-month rise since February 2021, indicating a cooling period after higher inflation rates experienced in recent years.

  • Core Inflation: Excluding volatile food and energy prices, core inflation was up by 3.2 percent year-over-year, suggesting underlying pressures remain despite the overall stabilization of the index.

  • Specific Categories: Noteworthy annual increases were seen in shelter (5.2 percent), while energy commodities experienced sharp declines, particularly gasoline and fuel oil, highlighting the fluctuating nature of energy markets.

Sector-Specific Insights:

  • Transportation: Airline fares notably increased by 3.9 percent in August after months of decline, likely reflecting seasonal travel adjustments and broader economic activities.

  • Medical and Apparel: Both sectors saw modest increases, indicating varied consumer spending behaviors across different areas.

Forward-Looking Implications:

The CPI data not only serves as a gauge of past and current economic conditions but also provides insights into potential future trends. The steadiness in core inflation suggests that while the economy faces inflationary pressures, they may be becoming more entrenched at a moderate level. This has implications for monetary policy, as policymakers must balance stimulating economic growth with preventing runaway inflation.

Consumer Impact:

For consumers, understanding the CPI is crucial as it affects everyday decision-making regarding spending, saving, and investing. The variations in food, energy, and housing costs directly impact budgeting and financial planning.

Conclusion:

As we look forward to the CPI data for September 2024, scheduled for release in October, stakeholders from policymakers to consumers should consider the nuanced changes in the CPI components. Staying informed will be key to navigating the economic landscape, which remains dynamic amid varying inflationary pressures.

Inflation continues to be a critical economic indicator that demands close monitoring. For those planning budgets or investments, keeping an eye on these trends can provide essential insights into timing and strategy adjustments necessary to safeguard financial health in an ever-changing economic environment.

Source: https://www.bls.gov/news.release/cpi.nr0.htm


Start futures forex fx news trading with Haawks G4A low latency machine-readable data, one of the fastest machine-readable news trading feed for US macro-economic and commodity data.

Please let us know your feedback. If you are interested in timestamps, please send us an email to sales@haawks.com.

Comment

Comment

32 pips potential profit in 69 seconds on 11 July 2024, analysis on futures forex fx low latency news trading USDJPY and EURUSD on US BLS Consumer Price Index (CPI) data

According to our analysis USDJPY and EURUSD moved 32 pips on US BLS Consumer Price Index (CPI) data on 11 July 2024.

USDJPY (12 pips)

EURUSD (20 pips)

Charts are exported from JForex (Dukascopy).


Navigating the Economic Waves: A Deep Dive into the June 2024 Consumer Price Index Report

The U.S. Bureau of Labor Statistics (BLS) recently released its Consumer Price Index (CPI) report for June 2024, revealing a nuanced snapshot of the current economic environment. The report, which saw a slight decline of 0.1% on a seasonally adjusted basis from the previous month, offers valuable insights into the shifting dynamics of consumer prices in the U.S. economy.

Key Highlights of the June 2024 CPI Report

The all items index, which measures a broad spectrum of consumer goods and services, rose by 3.0 percent over the last 12 months. This increment, though modest, indicates a slowdown from the 3.3 percent increase observed at the end of May 2024. Here's a closer look at some specific segments:

  • Energy: The index for gasoline plummeted by 3.8 percent in June, mirroring a similar drop in May. This continued decline significantly contributed to the overall decrease in the energy index, which also fell by 2.0 percent over the month.

  • Food: Contrary to the energy sector, food prices saw a slight increase. The overall food index rose by 0.2 percent, with the food away from home index up by 0.4 percent. This indicates sustained demand and perhaps a bit of resilience in the food sector despite broader economic conditions.

  • Core Inflation: When stripping out volatile food and energy prices, the core CPI (all items less food and energy) inched up by 0.1 percent in June. Notably, this represents the smallest monthly increase since August 2021, signaling a potential cooling of underlying inflationary pressures.

Sector-Specific Analysis

The shelter index continues to be a significant driver of the core inflation, despite only increasing by 0.2 percent in June. This subtle rise is the smallest since August 2021, potentially indicating a cooling in the housing market. Meanwhile, the indexes for motor vehicle insurance, household furnishings, and personal care all rose, underscoring that some areas of the economy are still experiencing upward price pressures.

Transportation services saw some of the most substantial fluctuations, particularly airline fares, which tumbled by 5.0 percent in June after a 3.6-percent decline in May. This drop could be reflecting seasonal adjustments or broader changes in consumer travel behavior.

Economic Implications and Consumer Impact

The latest CPI data suggests a mixed bag of economic signals. While the decline in energy prices can offer some relief to consumers, the rise in food and shelter costs could offset these benefits. Additionally, the modest rise in core CPI indicates that while inflationary pressures may be cooling, they remain present, affecting the cost of living and potentially influencing future monetary policy decisions.

For consumers, understanding these trends is crucial. Those planning budgets or major purchases will find it beneficial to track such indices closely, as they directly impact everyday expenses. On a broader scale, these trends also provide insight into the health of the U.S. economy, offering clues about potential future actions by policymakers, such as interest rate adjustments by the Federal Reserve.

Looking Ahead

As we move into the second half of 2024, all eyes will be on the upcoming July CPI report, due for release on August 14. Will the trend of modest increases continue, or will we see a reversal in certain sectors? Only time will tell, but for now, consumers and economists alike should remain vigilant, monitoring these indicators closely as they navigate the complex landscape of the U.S. economy.

In conclusion, the June 2024 CPI report paints a picture of an economy experiencing varied sectoral dynamics, highlighting the importance of nuanced analysis in understanding the overall economic health and making informed decisions.

Source: https://www.bls.gov/news.release/cpi.nr0.htm


Start futures forex fx news trading with Haawks G4A low latency machine-readable data, one of the fastest machine-readable news trading feed for US economic and commodity data.

Please let us know your feedback. If you are interested in timestamps, please send us an email to sales@haawks.com.

Comment

Comment

62 pips potential profit in 45 seconds on 12 June 2024, analysis on futures forex fx low latency news trading USDJPY and EURUSD on US BLS Consumer Price Index (CPI) data

According to our analysis USDJPY and EURUSD moved 62 pips on US BLS Consumer Price Index (CPI) data on 12 June 2024.

USDJPY (37 pips)

EURUSD (25 pips)

Charts are exported from JForex (Dukascopy).


Understanding the Consumer Price Index for May 2024: Insights and Implications

The recent release of the Consumer Price Index (CPI) data for May 2024 by the U.S. Bureau of Labor Statistics offers a detailed glimpse into the economic trends and consumer pricing landscape. Notably, the CPI for All Urban Consumers (CPI-U) remained unchanged in May, after a modest increase of 0.3 percent in April. Over the past 12 months, the overall index has seen an increase of 3.3 percent before seasonal adjustment.

Key Highlights from the May 2024 CPI Data:

  • Stable Consumer Prices: The overall stability in the CPI-U in May contrasts with the previous month's rise, reflecting a balance between sectors where prices increased and those that saw declines.

  • Shelter Costs Continue to Climb: The shelter index rose by 0.4 percent, maintaining the same growth rate for four consecutive months, which indicates a persistent upward pressure on housing costs.

  • Divergence in Food Prices: While the overall food index nudged up by 0.1 percent, significant variation was observed within this category. The food away from home index increased by 0.4 percent, in contrast to the unchanged status of the food at home index.

  • Decrease in Energy Prices: The energy index decreased by 2.0 percent in May, driven by a substantial 3.6 percent drop in the gasoline index. This decline helped offset some of the rising costs in other areas.

Detailed Analysis:

  1. Sector-Specific Trends:

    • Energy: The sharp decline in gasoline prices significantly impacted the energy sector, which saw an overall decline despite previous increases. This decrease in energy costs, while beneficial in curbing overall inflation, raises questions about the volatility in energy markets.

    • Food: The modest increase in the food index is reflective of a relatively stable food pricing environment, although variations exist between dining out and eating at home, with the former experiencing higher inflation.

    • Healthcare and Education: Both sectors saw increases, with medical care rising by 0.5 percent in May and education by 0.4 percent, indicating ongoing cost pressures in these essential services.

  2. Economic Implications:

    • The stability in the CPI indicates a balancing act between rising and falling sectors, suggesting that while certain costs continue to rise, overall inflation pressures are being moderated by declines in other areas like energy.

    • The persistent increase in shelter costs is a concern for long-term affordability and living standards, particularly in urban areas where CPI measurements are most applicable.

  3. What to Watch:

    • Future Energy Prices: Given the volatility in the energy sector, future reports should be closely monitored to gauge whether May’s decrease in energy prices is a temporary dip or the start of a longer-term trend.

    • Food and Shelter Costs: As these are significant components of the CPI and directly impact consumer budgets, ongoing increases could pose challenges for consumer spending power.

Conclusion:

The May 2024 CPI report highlights the complex interplay of various economic factors influencing consumer prices. With the index for all items less food and energy rising modestly, it’s crucial for policymakers and consumers alike to monitor these trends closely, particularly as they relate to the cost of living and inflation expectations.

Looking ahead, the next CPI release scheduled for July will provide further insights into whether these trends are solidifying, offering a clearer picture of the economic direction in the second half of 2024. For now, consumers and analysts alike would do well to keep an eye on the evolving economic landscape, especially in sectors like energy, food, and housing, which are crucial to everyday financial planning and policy formulation.

Source: https://www.bls.gov/news.release/cpi.nr0.htm


Start futures forex fx news trading with Haawks G4A low latency machine-readable data, one of the fastest machine-readable news trading feed for US economic and commodity data.

Please let us know your feedback. If you are interested in timestamps, please send us an email to sales@haawks.com.

Comment

Comment

104 pips potential profit in 33 seconds on 15 May 2024, analysis on futures forex fx news trading USDJPY and EURUSD on US Retail Sales and US BLS CPI data

According to our analysis USDJPY and EURUSD moved 104 pips on US Retail Sales and US BLS Consumer Price Index (CPI) data on 15 May 2024.

USDJPY (73 pips)

EURUSD (31 pips)

Charts are exported from JForex (Dukascopy).


Understanding the Latest Economic Indicators: April 2024 CPI and U.S. Retail Sales

The U.S. Bureau of Labor Statistics and the Census Bureau have recently released critical economic data for April 2024, covering the Consumer Price Index (CPI) and retail sales figures. These releases provide a comprehensive snapshot of the current economic environment, highlighting consumer inflation and retail activity. Let's delve into the details of each report and discuss their broader implications.

Consumer Price Index for April 2024

The Consumer Price Index for All Urban Consumers (CPI-U) rose by 0.3 percent in April on a seasonally adjusted basis, following a 0.4 percent increase in March. Annually, the all items index increased by 3.4 percent before seasonal adjustment. Key takeaways include:

  • Shelter and Gasoline Indexes: These indexes significantly contributed to the monthly CPI rise, with the energy index increasing by 1.1 percent primarily due to these components.

  • Stable Food Prices: The food index remained unchanged, with a notable decrease in the food at home category, offset by increases in food away from home.

  • Less Volatile Core Inflation: Excluding food and energy, the core index also rose by 0.3 percent, indicating stable underlying inflation.

Over the past 12 months, the energy index increased by 2.6 percent, while the food index rose by 2.2 percent, highlighting specific areas where consumers may feel budget pressures.

U.S. Retail Sales in April 2024

The advance estimates of U.S. retail and food services sales for April 2024 were virtually unchanged from March, adjusted for seasonal variation, but showed a 3.0 percent increase from April 2023. Highlights from the report include:

  • Steady Sales Figures: Total sales from February to April 2024 were up 3.0 percent from the same period a year ago, indicating a consistent growth in consumer spending.

  • Strong Online Sales: Nonstore retailers recorded a robust 7.5 percent increase from the previous year, underscoring the ongoing shift towards online shopping.

  • Food Services Growth: Food services and drinking places saw a significant 5.5 percent increase year over year, possibly reflecting consumer confidence and increased social activities.

Implications and Outlook

These reports suggest a cautiously optimistic economic outlook. While inflation, as indicated by the CPI, remains present, its growth is steady rather than sharp, suggesting that inflationary pressures might be stabilizing. Meanwhile, the solid performance in retail sales, particularly in nonstore retailers and food services, points to healthy consumer spending, which is crucial for continued economic growth.

However, the stable yet significant inflation highlighted by the CPI could impact consumer purchasing power, especially if wage growth does not keep pace. This dynamic warrants close monitoring as it may influence future consumer spending and economic policy decisions.

As we look towards the future, these indicators will be vital for policymakers, businesses, and consumers alike to gauge the economic landscape and make informed decisions. The next release in June will provide further insights into whether these trends are holding steady or shifting, marking critical data points for economic forecasts and strategies.

Source: https://www.census.gov/retail/sales.html, https://www.bls.gov/news.release/cpi.nr0.htm


Please let us know your feedback. If you are interested in timestamps, please send us an email to sales@haawks.com.

Start futures forex fx news trading with Haawks G4A low latency machine-readable data today, one of the fastest news data feeds for US macro-economic and commodity data.

Comment

Comment

57 pips potential profit in 46 seconds on 10 April 2024, analysis on futures forex fx low latency news trading USDJPY and EURUSD on US BLS CPI (Consumer Price Index) data

According to our analysis USDJPY and EURUSD moved 57 pips on US BLS CPI (Consumer Price Index) data on 10 April 2024.

USDJPY (25 pips)

EURUSD (32 pips)

Charts are exported from JForex (Dukascopy).


March 2024 Consumer Price Index Summary

The latest report from the U.S. Bureau of Labor Statistics on the Consumer Price Index (CPI) for March 2024 sheds light on current economic conditions, indicating both continuity and change in the inflation landscape. As consumers and analysts alike scrutinize these figures, it's crucial to unpack the nuances of the data to understand its implications for the economy, businesses, and everyday Americans.

CPI Overview for March 2024

In March 2024, the CPI for All Urban Consumers (CPI-U) experienced a 0.4 percent increase on a seasonally adjusted basis, mirroring the rise observed in February. Looking at the bigger picture, the all items index escalated by 3.5 percent over the last 12 months before seasonal adjustment, marking a notable trend in inflationary pressures.

The primary drivers of the monthly inflation increase were the shelter and gasoline indexes, which collectively contributed to more than half of the overall rise in the index for all items. Specifically, the energy index saw a 1.1 percent uplift, while food prices edged up by 0.1 percent. Notably, the food at home index remained stagnant, but the food away from home index climbed by 0.3 percent.

Key Components and Sectoral Impacts

  • Shelter and Energy: The shelter index continued its upward trajectory, alongside a significant 1.1 percent increase in the energy index. Gasoline prices, in particular, rose by 1.7 percent, reflecting broader energy market trends.

  • Food Index: The marginal 0.1 percent rise in the food index, coupled with a stable food at home index, suggests moderate food price inflation. However, the food away from home index's 0.3 percent increase points to costlier dining out experiences.

  • Core Inflation: Excluding food and energy, the core CPI rose by 0.4 percent for the third consecutive month. This consistent growth in core inflation underscores persistent inflationary pressures beyond volatile food and energy prices.

Yearly Inflation Trends

The 12-month overview reveals a 3.5 percent rise in the all items index, accelerating from the 3.2 percent increase ending February. Core inflation, excluding food and energy, climbed by 3.8 percent over the past year, indicating sustained inflationary pressure. Energy and food indexes rose by 2.1 percent and 2.2 percent, respectively, highlighting varied inflation dynamics across sectors.

Looking Ahead

The CPI data for March 2024 illustrates ongoing inflationary pressures within the U.S. economy, with significant contributions from shelter, energy, and certain food categories. While some sectors like used cars and trucks saw price decreases, the general trend indicates that inflation remains a concern.

For consumers, this means budgeting for higher costs in housing, energy, and dining out. Businesses, particularly in the energy, food service, and insurance sectors, will need to navigate these inflationary pressures carefully, balancing cost increases with consumer affordability.

As we move forward, monitoring these trends will be crucial for policymakers, businesses, and consumers alike to make informed decisions in an evolving economic landscape. The next CPI report, scheduled for release in May 2024, will be eagerly anticipated for further insights into inflationary trends and their potential implications.

Source: https://www.bls.gov/news.release/cpi.nr0.htm


Start futures forex fx news trading with Haawks G4A low latency machine-readable data, one of the fastest machine-readable news trading feed for US economic and commodity data.

Please let us know your feedback. If you are interested in timestamps, please send us an email to sales@haawks.com.

Comment

Comment

12 pips potential profit in 15 seconds on 21 March 2024, analysis on futures forex fx low latency news trading USDJPY and EURUSD on US Jobless Claims and US Philadelphia Fed Manufacturing data

According to our analysis USDJPY and EURUSD moved 12 pips on US Jobless Claims and US Philadelphia Federal Reserve Bank Manufacturing Business Outlook Survey data on 21 March 2024.

USDJPY (9 pips)

EURUSD (3 pips)

Charts are exported from JForex (Dukascopy).


Unpacking the March 2024 Manufacturing Business Outlook Survey Insights

The latest Manufacturing Business Outlook Survey, with responses gathered between March 11 and March 18, 2024, offers a nuanced view of the manufacturing sector's current health and its prospects. The survey, a bellwether for manufacturing trends, presents a mix of cautious optimism and areas of concern, reflecting the complex dynamics influencing the sector. Let’s delve into the key takeaways and what they mean for the industry moving forward.

Modest Growth Amidst Challenges

The survey underscores a continued expansion in manufacturing activity, albeit at a pace that suggests caution among industry players. The general activity index, a key measure of manufacturing health, recorded a slight dip to 3.2 in March, marking its second consecutive positive reading but highlighting a tempered outlook among firms. This modest growth is further evidenced by the positive turn in new orders, with the index rising to 5.4, and a slight uptick in shipments.

However, not all indicators are positive. The employment index remained in negative territory at -9.6, suggesting ongoing challenges in workforce dynamics. Moreover, both price indexes for inputs and outputs have decreased, remaining below long-run averages, pointing to a complex pricing environment faced by manufacturers.

Current Indicators and Future Outlook

While current indicators reflect a mixed bag of modest growth and persisting challenges, the future outlook provides a brighter picture. The future general activity index leapt to 38.6, the highest since July 2021, indicating stronger expectations for growth in the coming months. This optimism is echoed in the significant increases in future new orders and shipments indexes, suggesting that firms are anticipating a rebound in demand.

Furthermore, the survey’s special questions reveal insights into production growth and capacity utilization, with a higher share of firms reporting an increase in production for the first quarter of 2024 compared to the last quarter of 2023. The median current capacity utilization rate remains stable, with most firms indicating slight to moderate constraints from labor supply but less concern from supply chains.

Implications for the Manufacturing Sector

The March 2024 survey paints a picture of a manufacturing sector at a crossroads. On one hand, the continued expansion and optimistic future expectations reflect the resilience and potential for growth within the industry. On the other, the challenges in employment and price pressures underscore the ongoing adjustments firms must navigate in a post-pandemic world.

For industry leaders, the key takeaway is the importance of strategic planning and flexibility. Investing in workforce development and technology can help mitigate employment challenges, while agile pricing strategies may address the volatile cost environment. Moreover, the positive future outlook suggests that firms should prepare for increased demand, making this an opportune time to review and enhance production capabilities.

Looking Ahead

As the manufacturing sector continues to navigate through a landscape marked by both opportunities and challenges, the insights from the March 2024 Manufacturing Business Outlook Survey offer valuable guidance. By understanding the current trends and future expectations, manufacturers can better position themselves for growth, adapting to the evolving market dynamics with resilience and strategic foresight.

Source: https://www.philadelphiafed.org/surveys-and-data/regional-economic-analysis/mbos-2024-03


Start futures forex fx news trading with Haawks G4A low latency machine-readable data, one of the fastest machine-readable news trading feeds for US economic and commodity data.

Please let us know your feedback. If you are interested in timestamps, please send us an email to sales@haawks.com.

Comment

Comment

20 pips potential profit in 19 seconds on 12 March 2024, analysis on futures forex fx low latency news trading USDJPY and EURUSD on US BLS CPI (Consumer Price Index) data

According to our analysis USDJPY and EURUSD moved 20 pips on US BLS CPI (Consumer Price Index) data on 12 March 2024.

USDJPY (12 pips)

EURUSD (8 pips)

Charts are exported from JForex (Dukascopy).


Understanding the February 2024 Consumer Price Index Report: A Deep Dive

The Consumer Price Index (CPI) for February 2024 was released by the U.S. Bureau of Labor Statistics (BLS), marking an essential gauge for economists, policymakers, and consumers to understand the current economic climate and inflation trends. The CPI measures the average change over time in the prices paid by urban consumers for a market basket of consumer goods and services. Let's dive into the details of the February 2024 report to unpack what it means for the economy and individuals.

February 2024 CPI Highlights

In February 2024, the Consumer Price Index for All Urban Consumers (CPI-U) saw a seasonally adjusted increase of 0.4 percent, following a 0.3 percent rise in January. This incremental change points to a persistent upward pressure on prices across a broad array of goods and services. Over the past 12 months, the all items index has risen by 3.2 percent before seasonal adjustment, indicating a slight acceleration in inflationary pressures.

Key Contributors to the February Increase

Several key components contributed to the February rise in the CPI-U:

  • Shelter and Gasoline: The indexes for shelter and gasoline saw significant increases in February, together accounting for over sixty percent of the monthly rise in the all items index. This combination of higher housing and fuel costs can strain household budgets.

  • Energy: The energy index increased by 2.3 percent, with all its component indexes also on the rise, adding to the overall inflationary pressure.

  • Food: Interestingly, the food index remained unchanged in February, with both the food at home and food away from home indexes showing little to no growth. This stability in food prices offers a slight reprieve amidst the broader inflationary trends.

Annual Perspective

Looking at the annual figures, the all items index increased by 3.2 percent over the 12 months ending February 2024, a notch above the 3.1 percent increase for the year ending in January. Notably, the energy index decreased by 1.9 percent over this period, providing a mixed picture of the inflationary landscape.

Analyzing the Numbers: What This Means for You

The February 2024 CPI report underscores ongoing inflationary pressures within the U.S. economy. For consumers, the rise in shelter and gasoline prices could lead to higher living expenses, affecting budgets and spending habits. On the flip side, the stabilization in food prices, albeit temporary, offers some relief.

For policymakers, the report's insights into inflationary trends are crucial for shaping monetary policy and interest rate decisions. The data presents a balancing act between stimulating economic growth and curbing inflation to maintain price stability.

Looking Ahead

As we move forward into 2024, all eyes will be on the evolving economic indicators and their implications for inflation, consumer spending, and monetary policy. The Consumer Price Index, as a primary measure of inflation, will continue to play a pivotal role in these discussions. The next CPI report, scheduled for release in April 2024, will be eagerly awaited for further clues on the direction of the U.S. economy.

In summary, the February 2024 CPI report highlights the nuanced landscape of inflationary pressures facing the U.S. economy. While certain sectors like energy and shelter are driving price increases, the overall picture is complex, with stabilizing food prices providing a counterbalance. Understanding these dynamics is essential for navigating the economic challenges and opportunities that lie ahead.

Source: https://www.bls.gov/news.release/cpi.nr0.htm


Start futures forex fx news trading with Haawks G4A low latency machine-readable data, one of the fastest machine-readable news trading feed for US economic and commodity data.

Please let us know your feedback. If you are interested in timestamps, please send us an email to sales@haawks.com.

Comment