Viewing entries tagged
Retail Sales

Comment

20 pips and BTC 280 points potential profit in 218 seconds on 14 Februar 2025, analysis on futures forex fx news trading USDJPY and BTC on US Retail Sales data

According to our analysis USDJPY and BTC moved 20 pips and 280 points on US Retail Sales data on 14 February 2025.

USDJPY (20 pips)

BTC (280 points)

Charts are exported from JForex (Dukascopy).


Market Reaction: USD/JPY Drops, Bitcoin Rallies After Weak Retail Sales Data

📅 February 14, 2025

The latest U.S. retail sales report has sent ripples through financial markets, causing USD/JPY to drop 20 pips while Bitcoin surged 280 points. With traders reacting swiftly to the data, let’s break down what’s happening and how you can capitalize on the volatility.

📉 USD/JPY Falls 20 Pips – Weak U.S. Data Weighs on Dollar

The U.S. retail and food services sales for January fell 0.9% from December, worse than market expectations. While still up 4.2% YoY, the weaker month-over-month figure has sparked concerns about consumer spending trends.

💡 Market Reaction:

  • The dollar weakened as traders reassess Fed rate cut expectations—a slowdown in retail activity could push the Fed to ease sooner.

  • USD/JPY fell 20 pips as demand for the safe-haven yen increased.

  • U.S. Treasury yields ticked lower, signaling growing expectations of monetary easing.

🚀 Bitcoin Rallies 280 Points – Risk-On Sentiment Creeping Back?

Bitcoin surged 280 points following the report, as traders bet on softer economic data fueling rate cut speculation. With lower rates favoring risk assets, BTC has resumed its upward momentum.

📢 Final Thoughts

Today’s retail sales report has triggered FX and crypto volatility, with USD/JPY sliding and Bitcoin soaring. As traders digest the data, all eyes will be on Fed policy signals and risk sentiment in the coming days.

🚀 What’s your move? Are you shorting USD/JPY or riding the BTC rally? Drop your strategy in the comments!

Disclaimer: This blog post is for informational purposes only and should not be construed as financial advice. Always conduct thorough research and consider seeking advice from a financial professional before making any investment decisions.

Source: https://www.census.gov/retail/sales.html


Please let us know your feedback. If you are interested in timestamps, please send us an email to sales@haawks.com.

Start futures forex fx news trading with Haawks G4A low latency machine-readable data today, one of the fastest news data feeds for US macro-economic and commodity data.

Comment

Comment

47 pips potential profit in 91 seconds on 17 October 2024, analysis on futures forex fx news trading USDJPY and EURUSD on US Retail Sales, Jobless Claims and Philly Fed Manufacturing data

According to our analysis USDJPY and EURUSD moved 47 pips on US Retail Sales, US Jobless Claims and US Philadelphia Federal Reserve Bank Manufacturing Business Outlook Survey data on 17 October 2024.

USDJPY (32 pips)

EURUSD (15 pips)

Charts are exported from JForex (Dukascopy).


Economic Insights: Retail Sales, Unemployment Claims, and Manufacturing Outlook – October 17, 2024

Today, three significant economic reports were released, shedding light on the current state of U.S. retail, labor, and manufacturing sectors. These reports provide a snapshot of key economic indicators—retail sales performance, unemployment insurance claims, and regional manufacturing activity. Let’s break down each release to understand their implications and what they mean for the broader U.S. economy.

1. U.S. Retail and Food Services Sales - September 2024

The U.S. retail and food services sector continues to exhibit moderate growth, with September 2024 sales reaching $714.4 billion. This reflects a 0.4% increase from August 2024, and a 1.7% increase compared to September 2023. Over the three-month period from July to September, total sales grew 2.3% year-over-year, indicating a steady consumer demand despite economic headwinds.

Key highlights:

  • Nonstore retailers (e.g., e-commerce) showed remarkable resilience, posting a 7.1% year-over-year growth.

  • Food services and drinking places also saw an uptick, growing 3.7% from September 2023.

  • Traditional retail trade sales rose by 0.3% month-over-month and 1.4% year-over-year.

While the growth was moderate, the steady increase reflects resilience in consumer spending, a critical driver of economic activity in the U.S. economy. It will be important to monitor holiday season sales, as they could further influence retail performance into the year’s end.

2. Unemployment Insurance Weekly Claims - October 12, 2024

The labor market remains a focal point of economic analysis, and today’s unemployment insurance claims report offers some encouraging news. Initial jobless claims for the week ending October 12 decreased by 19,000 to 241,000, suggesting a stabilization in labor market conditions. While this is a positive sign, the four-week moving average—considered a more reliable indicator—rose slightly to 236,250, indicating some lingering volatility.

Other key labor data:

  • The insured unemployment rate remained steady at 1.2% for the week ending October 5.

  • Continuing claims (insured unemployment) rose by 9,000 to 1.867 million, signaling a slight increase in the number of individuals staying on unemployment benefits.

  • Despite this, the overall trend shows a labor market that remains robust, albeit with some fluctuations.

This drop in new claims aligns with the broader narrative of a tight labor market where employers are still holding on to workers despite broader economic uncertainty. However, as the Federal Reserve continues its balancing act between inflation control and employment growth, it will be important to watch whether these positive trends continue into the final months of 2024.

3. Manufacturing Business Outlook Survey - October 2024

The October Manufacturing Business Outlook Survey reveals encouraging signs of expansion in the manufacturing sector, particularly in the Mid-Atlantic region. The index for general activity surged to 10.3, up from 1.7 in September, marking a second consecutive month of growth. After a brief decline last month, both the new orders index (14.2) and shipments index (7.4) returned to positive territory, signaling renewed demand.

However, some challenges remain:

  • The employment index declined into negative territory at -2.2, suggesting that while most firms are maintaining steady employment, a small share of manufacturers are reducing their workforce.

  • Price pressures continue to persist, though the index for prices paid (input costs) dropped to 29.7, indicating a slight easing of inflationary pressures.

Looking ahead, manufacturers expressed optimism about future growth. The diffusion index for future general activity jumped to 36.7, with 47% of firms expecting increased activity over the next six months. This optimism is also reflected in anticipated capital expenditures for 2025, with 52% of firms planning to increase investments, particularly in software, hardware, and noncomputer equipment.

What Does This Mean for the Economy?

The combination of rising retail sales, stable unemployment claims, and expanding manufacturing activity paints a cautiously optimistic picture of the U.S. economy. While the labor market is still showing some signs of fluctuation, the underlying trends in consumer spending and manufacturing indicate resilience in key sectors.

The retail sector continues to grow, albeit modestly, suggesting consumers are still driving the economy forward. Meanwhile, the manufacturing sector is showing renewed strength, particularly in demand for goods. Labor markets remain tight, but the slight increase in continuing unemployment claims suggests there may still be some room for concern.

As we head into the holiday season and the final quarter of 2024, these reports will serve as important benchmarks for policymakers and investors. Will consumer demand stay strong? Can manufacturers keep pace with rising orders? And will labor markets continue to hold up against potential economic headwinds? These are the questions to keep an eye on as we move into 2025.

Stay tuned for further updates as more data emerges and economic conditions evolve.

Sources: https://www.census.gov/retail/sales.html, https://www.dol.gov/ui/data.pdf, https://www.philadelphiafed.org/surveys-and-data/regional-economic-analysis/mbos-2024-10


Please let us know your feedback. If you are interested in timestamps, please send us an email to sales@haawks.com.

Start futures forex fx news trading with Haawks G4A low latency machine-readable data today, one of the fastest news data feeds for US macro-economic and commodity data.

Comment

Comment

84 pips potential profit in 53 seconds on 15 August 2024, analysis on futures forex fx news trading USDJPY and EURUSD on US Retail Sales data

According to our analysis USDJPY and EURUSD moved 84 pips on US Retail Sales data on 15 August 2024.

USDJPY (63 pips)

EURUSD (21 pips)

Charts are exported from JForex (Dukascopy).


July 2024 Retail and Food Services Sales Show Solid Growth Amid Economic Uncertainty

The U.S. Census Bureau recently released its advance estimates for retail and food services sales in July 2024, showcasing a steady rise in consumer spending. Despite ongoing economic uncertainties, the report reveals encouraging signs for the retail sector, with both month-over-month and year-over-year growth exceeding expectations.

Key Highlights:

  • Total Sales: U.S. retail and food services sales for July 2024 were estimated at $709.7 billion. This marks a 1.0% increase from June 2024 and a 2.7% rise compared to July 2023.

  • Three-Month Comparison: Sales for the May through July 2024 period climbed by 2.4% compared to the same period in 2023, indicating a sustained upward trend in consumer spending.

  • Retail Trade: Sales in retail trade grew by 1.1% from June 2024 and by 2.6% year-over-year. This sector continues to be a vital component of the overall economy, reflecting consumer confidence and purchasing power.

  • Nonstore Retailers: Nonstore retailers, which include online shopping platforms, saw a significant 6.7% increase from July 2023. This growth underscores the ongoing shift towards e-commerce and the importance of digital channels in modern retail.

  • Food Services and Drinking Places: This category experienced a 3.4% rise from July 2023, highlighting the resilience of the hospitality sector as it continues to recover from the impacts of the pandemic.

Revised Data for June 2024

Interestingly, the previously reported data for June 2024 was slightly adjusted. Initially, the change from May to June was reported as virtually unchanged (±0.5 percent). However, this has been revised to reflect a modest decline of 0.2% (±0.2 percent). While this revision is minor, it points to the importance of accurate data collection and analysis in understanding economic trends.

What This Means for the Economy

The July 2024 retail and food services sales figures suggest that despite ongoing challenges, such as inflationary pressures and fluctuating consumer confidence, the U.S. economy continues to show resilience. The steady increase in sales, particularly in nonstore retail and food services, indicates that consumers are still willing to spend, especially in areas that offer convenience and experiences.

This growth is a positive indicator for businesses across the retail spectrum, from traditional brick-and-mortar stores to online platforms. The continued recovery in the food services sector is particularly noteworthy, as it reflects consumers' increasing comfort with dining out and engaging in social activities.

As we move forward, it will be essential to monitor how these trends evolve, especially in the face of potential economic headwinds. However, for now, the data from July 2024 provides a reason for cautious optimism in the retail and food services sectors.

Conclusion

The latest advance estimates from the U.S. Census Bureau paint a picture of steady growth in consumer spending across retail and food services in July 2024. With a 1.0% month-over-month increase and a 2.7% rise compared to the previous year, the data suggests that the U.S. economy remains on a solid footing. As businesses continue to navigate an evolving economic landscape, these figures offer a glimmer of hope and a sign that the retail sector, in particular, is adapting and thriving.

Stay tuned for further updates and analysis as we continue to track these critical economic indicators.

Source: https://www.census.gov/retail/sales.html


Please let us know your feedback. If you are interested in timestamps, please send us an email to sales@haawks.com.

Start futures forex fx news trading with Haawks G4A low latency machine-readable data today, one of the fastest news data feeds for US macro-economic and commodity data.

Comment

Comment

40 pips potential profit in 5 seconds on 16 July 2024, analysis on futures forex fx news trading USDJPY and EURUSD on US Retail Sales data

According to our analysis USDJPY and EURUSD moved 40 pips on US Retail Sales data on 16 July 2024.

USDJPY (29 pips)

EURUSD (11 pips)

Charts are exported from JForex (Dukascopy).


Analyzing the Latest U.S. Retail and Food Services Sales Data for June 2024

In the latest release from the U.S. Census Bureau, the advance estimates for retail and food services sales in June 2024 presented a mixed bag of results that offer insights into consumer spending habits and economic trends. According to the report, total sales amounted to $704.3 billion, showing no significant change from May 2024 but reflecting a moderate increase of 2.3 percent from June 2023.

A Closer Look at the Numbers

The data, adjusted for seasonal variations and differences in trading days and holidays, provides a clear picture of the market's stability and growth over the past year. Despite the static growth from the previous month, there is a positive uptrend when comparing the data year-over-year. From April to June 2024, total sales saw an increase of 2.5 percent from the same period last year, indicating a steady rise in consumer expenditure.

Interestingly, the April to May 2024 data was revised upward, from a marginal 0.1 percent increase to a more noticeable 0.3 percent. This revision suggests that consumer spending has been slightly more robust than initially estimated.

Sector-Specific Trends

The retail trade sector specifically showed a minor decline of 0.1 percent from May 2024, yet it experienced a 2.0 percent increase compared to last year. This suggests a slow but steady recovery and growth over the long term. Nonstore retailers, which include online and e-commerce platforms, notably outperformed other categories with an impressive 8.9 percent increase from June 2023. This highlights the continuing shift towards online shopping and the strength of digital marketplaces.

On the other hand, food services and drinking places also saw a significant uptick, with sales rising by 4.4 percent from the previous year. This increase may be indicative of a rebound in dining out as consumer confidence in public health safety grows and social restrictions related to the pandemic continue to ease.

What This Means for the Economy

The mixed signals from the June 2024 data reflect the complex interplay of economic recovery, inflation concerns, and shifts in consumer behavior. The stability in month-over-month sales juxtaposed with the annual increases suggests that while the market is not booming, it is resilient amid economic uncertainties.

For investors and business owners, these trends underscore the importance of adjusting to the growing online consumer base and the recovering food service industry. Businesses that can navigate the balance between digital and physical sales channels are likely to see continued success.

Final Thoughts

As we move further into the second half of 2024, all eyes will be on how these trends develop, particularly in the context of economic policies and global market conditions. Will the momentum in nonstore retail and food services continue? How will macroeconomic factors like inflation and employment rates affect consumer spending?

These are critical questions for market analysts, investors, and policymakers as they plan for the coming months. Keeping a close eye on these trends will be key to understanding and anticipating the needs of the U.S. consumer in a rapidly evolving economic landscape.

Source: https://www.census.gov/retail/sales.html


Please let us know your feedback. If you are interested in timestamps, please send us an email to sales@haawks.com.

Start futures forex fx news trading with Haawks G4A low latency machine-readable data today, one of the fastest news data feeds for US macro-economic and commodity data.

Comment

Comment

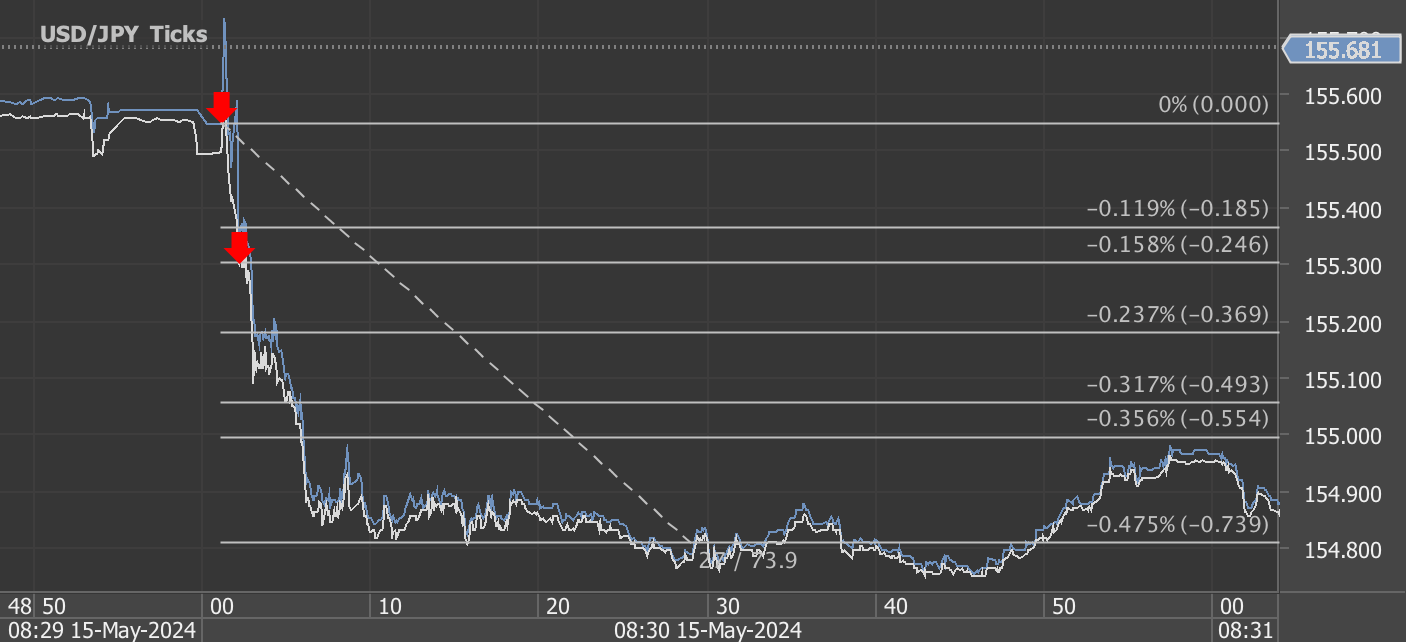
104 pips potential profit in 33 seconds on 15 May 2024, analysis on futures forex fx news trading USDJPY and EURUSD on US Retail Sales and US BLS CPI data

According to our analysis USDJPY and EURUSD moved 104 pips on US Retail Sales and US BLS Consumer Price Index (CPI) data on 15 May 2024.

USDJPY (73 pips)

EURUSD (31 pips)

Charts are exported from JForex (Dukascopy).


Understanding the Latest Economic Indicators: April 2024 CPI and U.S. Retail Sales

The U.S. Bureau of Labor Statistics and the Census Bureau have recently released critical economic data for April 2024, covering the Consumer Price Index (CPI) and retail sales figures. These releases provide a comprehensive snapshot of the current economic environment, highlighting consumer inflation and retail activity. Let's delve into the details of each report and discuss their broader implications.

Consumer Price Index for April 2024

The Consumer Price Index for All Urban Consumers (CPI-U) rose by 0.3 percent in April on a seasonally adjusted basis, following a 0.4 percent increase in March. Annually, the all items index increased by 3.4 percent before seasonal adjustment. Key takeaways include:

  • Shelter and Gasoline Indexes: These indexes significantly contributed to the monthly CPI rise, with the energy index increasing by 1.1 percent primarily due to these components.

  • Stable Food Prices: The food index remained unchanged, with a notable decrease in the food at home category, offset by increases in food away from home.

  • Less Volatile Core Inflation: Excluding food and energy, the core index also rose by 0.3 percent, indicating stable underlying inflation.

Over the past 12 months, the energy index increased by 2.6 percent, while the food index rose by 2.2 percent, highlighting specific areas where consumers may feel budget pressures.

U.S. Retail Sales in April 2024

The advance estimates of U.S. retail and food services sales for April 2024 were virtually unchanged from March, adjusted for seasonal variation, but showed a 3.0 percent increase from April 2023. Highlights from the report include:

  • Steady Sales Figures: Total sales from February to April 2024 were up 3.0 percent from the same period a year ago, indicating a consistent growth in consumer spending.

  • Strong Online Sales: Nonstore retailers recorded a robust 7.5 percent increase from the previous year, underscoring the ongoing shift towards online shopping.

  • Food Services Growth: Food services and drinking places saw a significant 5.5 percent increase year over year, possibly reflecting consumer confidence and increased social activities.

Implications and Outlook

These reports suggest a cautiously optimistic economic outlook. While inflation, as indicated by the CPI, remains present, its growth is steady rather than sharp, suggesting that inflationary pressures might be stabilizing. Meanwhile, the solid performance in retail sales, particularly in nonstore retailers and food services, points to healthy consumer spending, which is crucial for continued economic growth.

However, the stable yet significant inflation highlighted by the CPI could impact consumer purchasing power, especially if wage growth does not keep pace. This dynamic warrants close monitoring as it may influence future consumer spending and economic policy decisions.

As we look towards the future, these indicators will be vital for policymakers, businesses, and consumers alike to gauge the economic landscape and make informed decisions. The next release in June will provide further insights into whether these trends are holding steady or shifting, marking critical data points for economic forecasts and strategies.

Source: https://www.census.gov/retail/sales.html, https://www.bls.gov/news.release/cpi.nr0.htm


Please let us know your feedback. If you are interested in timestamps, please send us an email to sales@haawks.com.

Start futures forex fx news trading with Haawks G4A low latency machine-readable data today, one of the fastest news data feeds for US macro-economic and commodity data.

Comment

Comment

39 pips potential profit in 69 seconds on 15 April 2024, analysis on futures forex fx news trading USDJPY and EURUSD on US Retail Sales data

According to our analysis USDJPY and EURUSD moved 39 pips on US Retail Sales data on 15 April 2024.

USDJPY (28 pips)

EURUSD (11 pips)

Charts are exported from JForex (Dukascopy).


U.S. Retail and Food Services Sales Surge in March 2024: A Sign of Economic Resilience

In a promising turn of events for the U.S. economy, the latest figures released by the U.S. Census Bureau reveal a robust uptick in retail and food services sales for the month of March 2024. The advance estimates, adjusted for seasonal variation and other factors, paint a picture of resilience and growth despite ongoing global uncertainties.

According to the report, U.S. retail and food services sales for March 2024 reached an impressive $709.6 billion, marking a 0.7 percent increase from the previous month. Even more encouraging is the year-over-year comparison, with sales up by 4.0 percent compared to March 2023. This steady growth trajectory suggests a buoyant consumer sentiment and a healthy appetite for spending.

Digging deeper into the numbers, it's evident that various sectors contributed to this positive trend. Retail trade sales, for instance, saw a notable 0.8 percent uptick from February 2024, signaling increased consumer activity across a range of goods and services. Nonstore retailers emerged as a standout performer, boasting an impressive 11.3 percent increase from the previous year. This surge in online shopping underscores the continued shift towards e-commerce platforms and highlights the importance of digital infrastructure in today's retail landscape.

Equally noteworthy is the resilience displayed by food services and drinking places, which saw a commendable 6.5 percent rise from March 2023. Despite challenges posed by the ongoing pandemic and fluctuating consumer preferences, the food and beverage industry has demonstrated remarkable adaptability and innovation, catering to evolving demands and ensuring customer satisfaction.

Moreover, the report provides insight into the broader economic trajectory, with total sales for the January 2024 through March 2024 period showing a 2.1 percent increase compared to the same period a year ago. This sustained growth over multiple months underscores the underlying strength of the U.S. economy and bodes well for future prospects.

It's worth noting the revised figures for the January 2024 to February 2024 percent change, which was adjusted upwards from 0.6 percent to 0.9 percent. This upward revision reflects a more optimistic outlook and reinforces the narrative of steady expansion in consumer spending.

Overall, the latest data on retail and food services sales in March 2024 paints a picture of resilience and optimism in the face of challenges. As the economy continues to recover and adapt to changing dynamics, these figures serve as a testament to the resilience of businesses and the enduring spirit of consumer confidence. With prudent policies and innovative strategies, the U.S. is well-positioned to navigate the road ahead and emerge stronger than ever before.

Source: https://www.census.gov/retail/sales.html


Please let us know your feedback. If you are interested in timestamps, please send us an email to sales@haawks.com.

Start futures forex fx news trading with Haawks G4A low latency machine-readable data today, one of the fastest news data feeds for US macro-economic and commodity data.

Comment

Comment

35 pips potential profit in 25 seconds on 15 February 2024, analysis on futures forex fx news trading USDJPY and EURUSD on US Philly Fed Manufacturing and US Retail Sales data

According to our analysis USDJPY and EURUSD moved 35 pips on US Philadelphia Federal Reserve Bank Manufacturing Business Outlook Survey data and US Retail Sales data on 15 February 2024.

USDJPY (21 pips)

EURUSD (14 pips)

Charts are exported from JForex (Dukascopy).


Analyzing the Latest Economic Indicators: Retail Sales and Manufacturing Sector Insights

In the ever-evolving landscape of the U.S. economy, recent releases from the Commerce Department and the Federal Reserve Bank offer critical insights into consumer behavior and manufacturing activity. The Advance Monthly Sales for Retail and Food Services report and the February 2024 Manufacturing Business Outlook Survey provide a mixed picture of the current economic environment, with signs of resilience in certain sectors despite overarching challenges. Let's delve into the details of both releases to understand their implications.

Retail Sales Take a Slight Dip with a Silver Lining

According to the Commerce Department's report for January 2024, U.S. retail and food services sales saw a minor retreat, marking a 0.8 percent decrease from the previous month, yet they experienced a 0.6 percent increase from January 2023. This nuanced performance underscores a broader trend of cautious consumer spending amidst economic uncertainties. Total sales for the November 2023 through January 2024 period, however, were up 3.1 percent from the same period a year ago, indicating a sustained appetite for retail and food services over the longer term.

The report also highlighted significant sectoral disparities. While traditional retail trade sales dipped slightly, nonstore retailers and food services continued to exhibit strong growth, suggesting a shift in consumer preferences towards online shopping and dining out. This divergence reflects the dynamic nature of consumer spending patterns and the ongoing adaptation of the retail sector to changing tastes and technological advancements.

Manufacturing Sector Shows Signs of Cautious Optimism

The Federal Reserve Bank's February 2024 Manufacturing Business Outlook Survey presents a cautiously optimistic view of the manufacturing sector. After months of subdued activity, the survey's indicators for general activity and shipments turned positive, signaling a potential rebound. However, the new orders index, despite improvements, remained in negative territory, indicating persistent challenges in demand.

Employment in the manufacturing sector appears to be contracting, with the employment index dropping to its lowest reading since May 2020. This suggests that manufacturers are becoming more cautious in their hiring, possibly due to uncertainties about future demand and operational costs.

Price indexes, while indicating overall increases, remain below long-run averages, hinting at a complex pricing environment where firms are possibly facing pressures to manage costs amidst fluctuating demand.

Looking ahead, the survey's future activity indicators suggest that manufacturers are growing more optimistic about growth over the next six months. This optimism is reflected in the expectations for increased activity, new orders, and even capital expenditures, pointing towards a cautious but hopeful outlook for the manufacturing sector.

Conclusion

The contrasting narratives from the retail and manufacturing sectors highlight the multifaceted nature of the current economic landscape. On one hand, consumer spending in the retail sector shows resilience, with significant growth in online shopping and food services. On the other hand, the manufacturing sector, while facing immediate challenges, is cautiously optimistic about the future.

These developments suggest that while the economy navigates through uncertainties, certain sectors continue to adapt and find growth opportunities. For businesses and policymakers, understanding these nuanced dynamics is crucial for making informed decisions and fostering a supportive environment for growth and stability in the changing economic climate.

Source: https://www.census.gov/retail/sales.html, https://www.philadelphiafed.org/surveys-and-data/regional-economic-analysis/mbos-2024-02


Please let us know your feedback. If you are interested in timestamps, please send us an email to sales@haawks.com.

Start futures forex fx news trading with Haawks G4A low latency machine-readable data today, one of the fastest news data feeds for US macro-economic and commodity data.

Comment

Comment

76 pips and 66 points potential profit in 518 seconds on 15 November 2023, analysis on futures forex fx news trading USDJPY, EURUSD and US30 on US Producer Price Index (PPI) and Retail Sales data

According to our analysis USDJPY and EURUSD moved 76 pips and US30 moved 66 points on US Producer Price Index (PPI) and US Retail Sales data on 15 November 2023.

USDJPY (54 pips)

EURUSD (22 pips)

US30 (66 points)

Charts are exported from JForex (Dukascopy).


Decoding Economic Metrics: PPI and Retail Sales Analysis

Introduction:

In the intricate realm of economic data, the Producer Price Index (PPI) and Retail Sales serve as critical gauges, offering nuanced insights into inflationary pressures and consumer behavior. In this analytical discourse, we delve into the latest iterations of these indicators—October 2023's PPI and Retail Sales—unveiling the underlying economic narratives and the potential implications for financial markets.

Producer Price Index (PPI) Insights:

The PPI for final demand witnessed a notable contraction of 0.5 percent in October 2023, marking the most substantial downturn since April 2020. The catalyst behind this descent was a pronounced 6.5 percent decline in the index for final demand energy, indicating a substantial recalibration in energy-related price dynamics.

On an annualized basis, the unadjusted PPI for final demand posted a modest 1.3 percent increase, while the index for final demand less foods, energy, and trade services exhibited a more robust 2.9 percent ascent. This exclusionary measure provides a clearer lens into core price movements, discounting the volatility introduced by food, energy, and trade services.

PPI's Market Implications:

The market's response to PPI nuances can be discerned through shifts in expectations around inflation. A decline in the PPI may trigger reassessments of inflationary pressures, potentially influencing central banks in their policy deliberations. Investors, attuned to these shifts, may recalibrate their portfolios in response to evolving economic projections.

Retail Sales: Deciphering Consumer Sentiment:

October 2023's retail and food services sales registered a marginal 0.1 percent contraction from the preceding month, totaling $705.0 billion. However, a more sanguine narrative emerges from the 2.5 percent year-over-year uptick, reflecting the resilience of consumer spending in the face of economic flux.

While retail trade sales retreated by 0.2 percent from September, they advanced by 1.6 percent compared to the previous year. Noteworthy is the commendable 7.6 percent surge in nonstore retailers, underscoring the continued prominence of e-commerce in shaping retail landscapes.

Interpreting Retail Sales in the Market Context:

Retail sales data holds a mirror to consumer confidence and economic vitality. A contraction in retail sales may evoke concerns about the durability of economic growth, impacting sectors tethered to consumer demand. Conversely, an upward trajectory in retail sales figures may inject optimism into investor sentiments.

Synthesis: Market Response to PPI and Retail Sales:

The market's immediate reaction manifested in currency and stock markets. The USD/JPY pair appreciated by 54 pips, signaling a favorable outlook for the US Dollar against the Japanese Yen. Conversely, the EUR/USD pair depreciated by 22 pips, portraying a reduction in the Euro's value against the US Dollar. The US30, representative of the Dow Jones Industrial Average, declined by 66 points, suggestive of a potentially cautious or pessimistic sentiment within equity markets.

Conclusion:

In the intricate choreography of economic indicators, the PPI and Retail Sales are pivotal performers, dictating market rhythms and investor sentiments. This nuanced analysis underscores the importance of these metrics in navigating the complex terrain of economic landscapes, offering stakeholders a compass to steer through the intricacies of global financial dynamics.

Source: https://www.census.gov/retail/sales.html, https://www.bls.gov/news.release/ppi.nr0.htm


Please let us know your feedback. If you are interested in timestamps, please send us an email to sales@haawks.com.

Start futures forex fx news trading with Haawks G4A low latency machine-readable data today, one of the fastest news data feeds for US macro-economic and commodity data.

Comment

Comment

13 pips potential profit in 56 seconds on 17 October 2023, analysis on futures forex fx news trading USDJPY and EURUSD on US Retail Sales data

According to our analysis USDJPY and EURUSD moved 13 pips on US Retail Sales data on 17 October 2023.

USDJPY (10 pips)

EURUSD (3 pips)

Charts are exported from JForex (Dukascopy).


Summary of U.S. Retail and Food Services Sales - September 2023

The advance estimates of U.S. retail and food services sales for September 2023 reveal significant insights into the nation's economic activity:

  • Total Sales: Adjusted for seasonal variations, as well as holiday and trading-day differences, total sales for September 2023 reached approximately $704.9 billion. This represents a notable increase of 0.7 percent from the previous month.

  • Year-on-Year Growth: Comparing September 2023 to the same month in 2022, total sales demonstrated substantial growth, showing an increase of 3.8 percent.

  • Quarterly Performance: Analyzing the July 2023 through September 2023 period in comparison to the same period a year earlier, sales exhibited a solid rise of 3.1 percent.

  • August 2023 Revision: The percent change between July 2023 and August 2023 was revised from an initial estimate of 0.6 percent to an upwardly adjusted figure of 0.8 percent.

  • Retail Trade: Retail trade sales in September 2023 increased by 0.7 percent compared to August 2023. Furthermore, retail trade sales saw a positive growth of 3.0 percent in comparison to September 2022.

  • Key Contributors: Nonstore retailers experienced substantial year-on-year growth of 8.4 percent, while food services and drinking places also demonstrated a notable increase of 9.2 percent when compared to September 2022.

These figures provide a snapshot of consumer activity, indicating positive trends in retail and food services sales. The data underscores the resilience and growth of the U.S. economy during this period.

Source: https://www.census.gov/retail/sales.html


Please let us know your feedback. If you are interested in timestamps, please send us an email to sales@haawks.com.

Start futures forex fx news trading with Haawks G4A low latency machine-readable data today, the fastest news data feed for US economic and commodity data.

Comment

Comment

271 pips potential profit in 530 seconds on 28 July 2023, analysis on futures forex fx news trading EURSEK first on Sweden Gross Domestic Product (GDP), Retail Sales and Labour Force data

According to our analysis EURSEK moved 271 pips on Sweden Gross Domestic Product (GDP), Sweden Retail Sales and Sweden Labour Force data on 28 July 2023.

Start futures forex fx news trading with Haawks G4A low latency machine-readable data today, the fastest news data feed for US economic and commodity data.

Please let us know your feedback. If you are interested in timestamps, please send us an email to sales@haawks.com.

EURSEK (271 pips)

Charts are exported from JForex (Dukascopy).

Comment