Viewing entries tagged
PPI

Comment

31 pips potential profit in 43 seconds on 14 November 2024, analysis on futures forex fx low latency news trading USDJPY and EURUSD on US BLS Producer Price Index (PPI) data

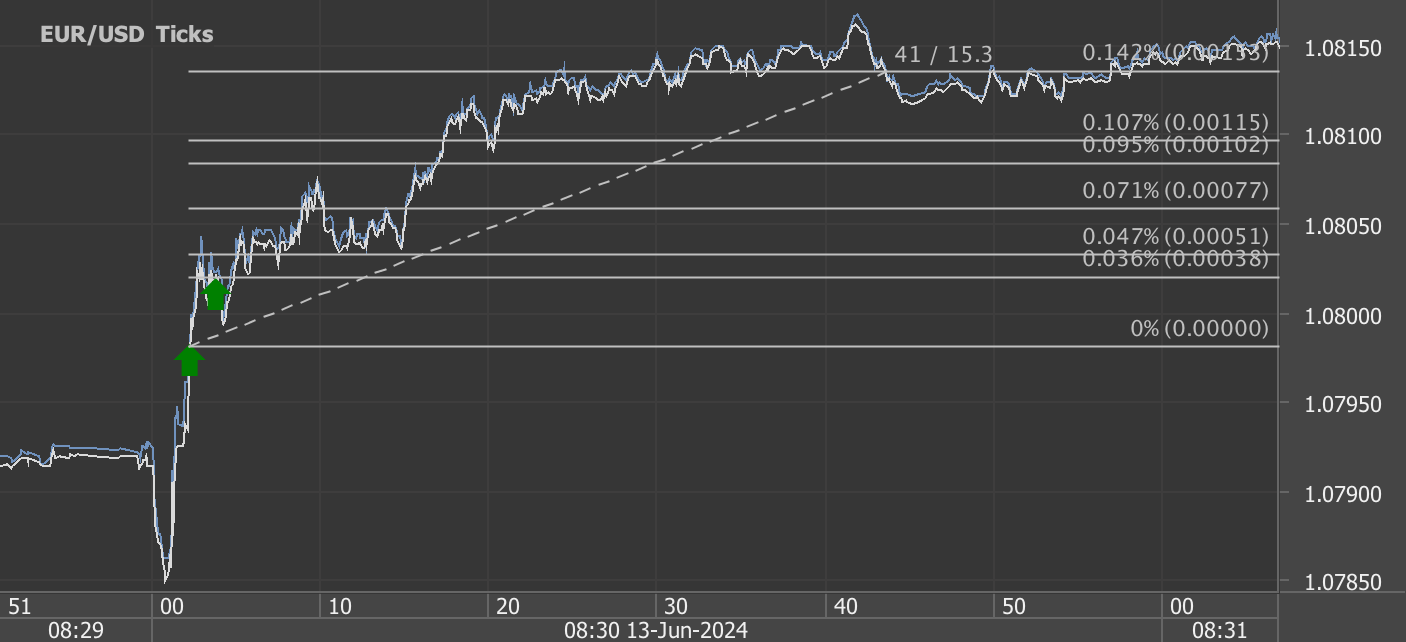
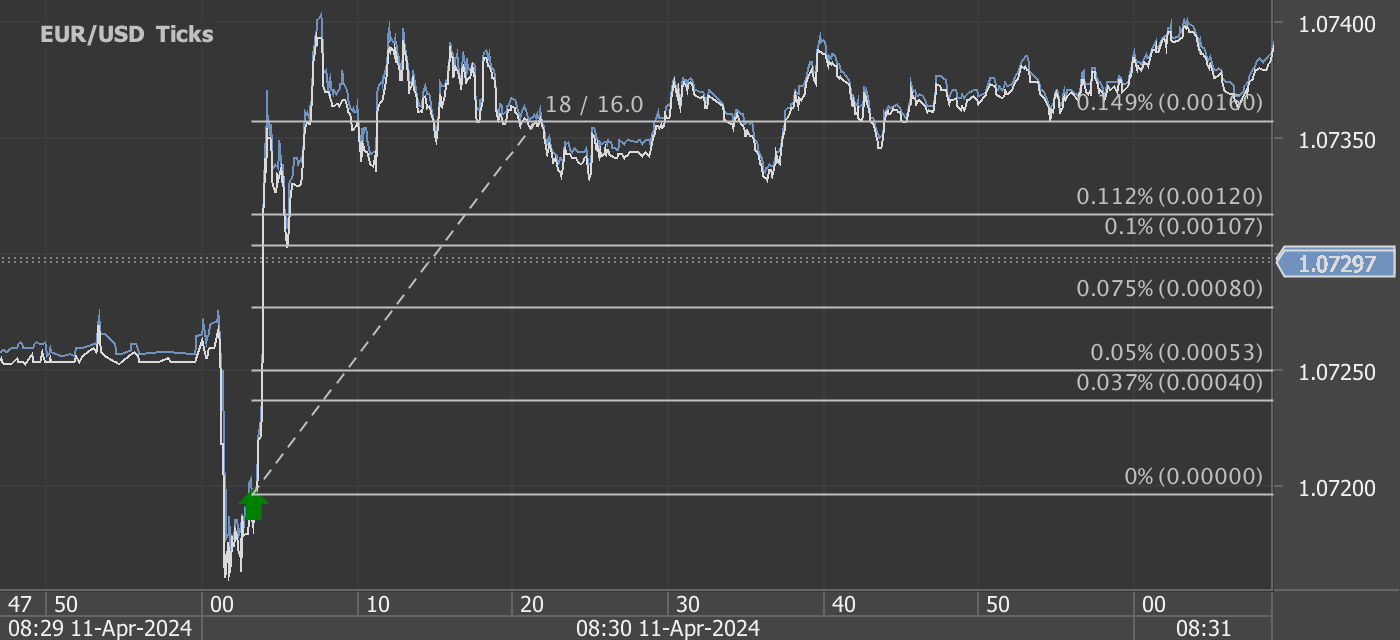
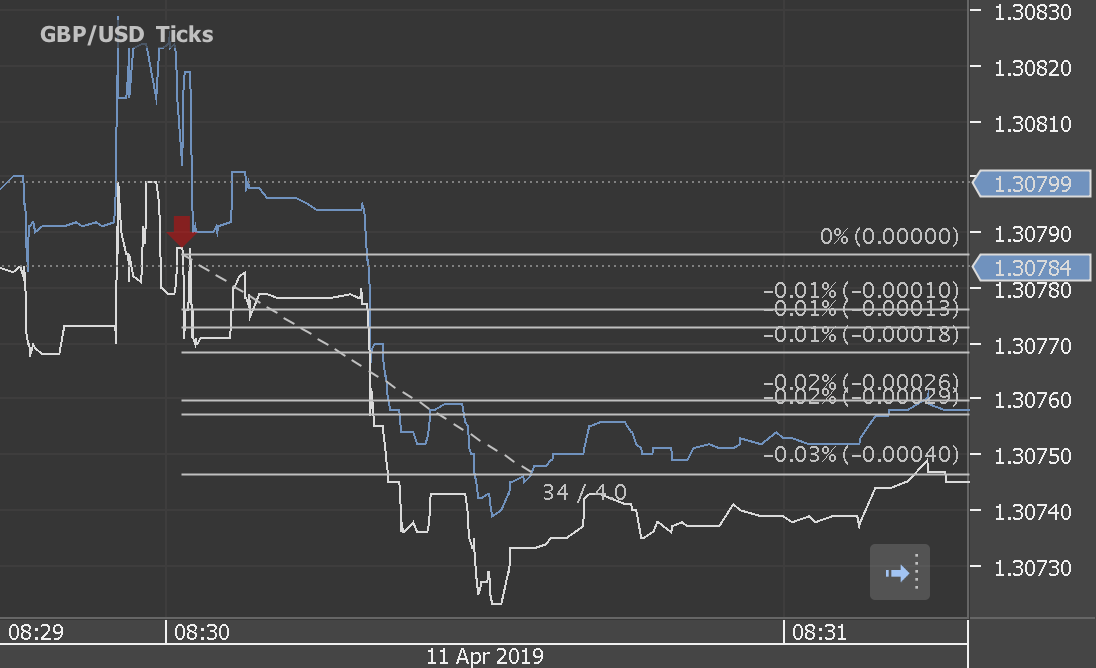
According to our analysis USDJPY and EURUSD moved 31 pips on US BLS Producer Price Index (PPI) data on 14 November 2024.

USDJPY (20 pips)

EURUSD (11 pips)

Charts are exported from JForex (Dukascopy).


October 2024 Producer Price Index Report: Key Takeaways and Insights

The U.S. Bureau of Labor Statistics (BLS) recently released its Producer Price Index (PPI) report for October 2024, highlighting an incremental rise in wholesale prices across several categories. The report provides a valuable gauge of inflation trends within the economy as it captures the price changes from producers' perspectives. Let’s dive into the major insights and explore what they mean for businesses, policymakers, and consumers.

Overview of the October PPI Data

The PPI for final demand rose by 0.2% in October, following a modest increase of 0.1% in September. Over the past 12 months, the final demand index rose by 2.4%, signaling steady, though contained, inflationary pressures on the production side. Excluding the more volatile food, energy, and trade services, the index increased by 0.3% in October and 3.5% year-over-year, indicating some underlying inflation in core producer prices.

Final Demand Services: Primary Driver of October's Price Increase

A significant portion of the October PPI increase stemmed from final demand services, which advanced by 0.3%. This rise marks a steady increase from previous months and reflects broad-based price gains within service sectors:

  • Services excluding trade, transportation, and warehousing showed a 0.3% increase, leading the rise in service prices.

  • Transportation and warehousing services experienced a 0.5% price hike, indicating higher operating costs within logistics networks.

  • Portfolio management services saw a notable 3.6% price increase, contributing significantly to the overall rise in service prices.

This uptick in service-related costs can affect businesses reliant on professional services, financial services, and logistics, potentially impacting prices downstream.

Final Demand Goods: A Modest Rise in Prices

The index for final demand goods increased slightly by 0.1% in October after consecutive declines. Notably:

  • Goods excluding food and energy climbed by 0.3%, suggesting steady demand for manufactured goods.

  • Energy prices fell by 0.3%, while food prices saw a modest decrease of 0.2%.

The standout here was the 8.4% jump in the price of carbon steel scrap, reflecting price fluctuations in raw materials that could affect various industries, including construction and manufacturing.

Intermediate Demand Insights: Processed and Unprocessed Goods Climb Higher

Intermediate demand, representing the cost of goods and services in the production process, displayed varied trends:

  • Processed goods for intermediate demand rose by 0.5% after two months of declines, largely due to higher prices for processed materials excluding food and energy. Year-over-year, however, processed goods have declined by 1.2%.

  • Unprocessed goods for intermediate demand saw a more significant jump of 4.1%, the largest since August 2022. A 9.9% increase in energy materials, particularly crude petroleum, drove this rise.

These price increases at the intermediate stage may signal cost pressures on manufacturers and suppliers, likely influencing prices for consumers and businesses in the near future.

Stages of Production Analysis

Examining the PPI by production stages provides additional insight into where price changes are occurring in the supply chain:

  • Stage 4 intermediate demand (goods closest to final production) rose 0.2%, with notable increases in diesel fuel and rents for office and retail properties.

  • Stage 3 intermediate demand climbed by 0.5%, driven by goods inputs like diesel fuel and slaughter poultry.

  • Stage 2 intermediate demand increased by 1.5%, with goods inputs up by 3.8% due to jumps in crude petroleum and carbon steel scrap.

  • Stage 1 intermediate demand showed a 0.3% rise, propelled by higher prices for airline passenger services and carbon steel scrap.

What These Trends Mean for the Economy

The steady increases in October’s PPI, particularly within services and intermediate goods, suggest that inflationary pressures are present but not severe. Here’s what this could mean for different stakeholders:

  1. For businesses: Rising input costs, especially in services and core goods, may lead to increased expenses for production and logistics. Businesses may need to consider cost-management strategies or price adjustments to maintain margins.

  2. For policymakers: The continued rise in core PPI components could influence monetary policy decisions. The Federal Reserve may view these trends as an indication of persistent inflation within the supply chain, potentially affecting interest rate policies.

  3. For consumers: While direct consumer prices aren’t covered in the PPI, higher production costs can often translate into retail price increases. Consumers may notice price adjustments in areas affected by rising wholesale service costs, including travel, healthcare, and retail products.

Looking Ahead: What to Watch for in November

The next PPI release, scheduled for December 12, 2024, will reveal if these inflationary pressures persist into the year’s final quarter. Key areas to monitor include:

  • Service sector trends: As services remain a major factor in the overall PPI, any shifts here could influence broader price stability.

  • Intermediate demand for goods: Further rises in intermediate demand could signal ongoing supply chain pressures, especially if energy costs remain volatile.

In sum, October’s PPI report underscores that while inflationary pressures are present, they remain relatively contained and sector-specific. By keeping an eye on these trends, businesses and consumers can better anticipate potential price changes as the economy progresses into 2024.

Source: https://www.bls.gov/news.release/ppi.nr0.htm


Start futures forex fx news trading with Haawks G4A low latency machine-readable data, one of the fastest machine-readable news trading feed for US economic and commodity data.

Please let us know your feedback. If you are interested in timestamps, please send us an email to sales@haawks.com.

Comment

Comment

44 pips potential profit in 42 seconds on 13 June 2024, analysis on futures forex fx low latency news trading USDJPY and EURUSD on US BLS Producer Price Index (PPI) data

According to our analysis USDJPY and EURUSD moved 44 pips on US Jobless Claims and US BLS Producer Price Index (PPI) data on 13 June 2024.

USDJPY (29 pips)

EURUSD (15 pips)

Charts are exported from JForex (Dukascopy).


Analyzing the Dip: A Closer Look at the May 2024 Producer Price Index Report

The U.S. Bureau of Labor Statistics' latest release of the Producer Price Index (PPI) for May 2024 presents some intriguing shifts in the economic landscape. The report, detailing the movements in prices from a producer's perspective, shows a decline in final demand by 0.2 percent. This is particularly notable following a 0.5 percent increase in April and a slight decrease in March. Over the past 12 months, however, the index for final demand has advanced 2.2 percent on an unadjusted basis.

Key Highlights from the May 2024 PPI Report

Decline in Final Demand Goods: The report indicates a significant 0.8 percent drop in final demand goods, marking the largest decline since October 2023. A major contributor to this decrease was the energy sector, which plummeted by 4.8 percent. This sharp decline in energy prices, particularly a 7.1-percent decrease in gasoline prices, heavily influenced the overall drop in goods prices.

Stability in Services: In contrast to goods, prices for final demand services remained unchanged in May, after a rise in the previous month. Within the services category, trade services and services excluding trade, transportation, and warehousing saw minor increases of 0.2 percent and 0.1 percent, respectively. However, transportation and warehousing services experienced a notable drop of 1.4 percent.

Intermediate Demand: Intermediate demand also saw significant shifts, with processed goods for intermediate demand falling by 1.5 percent, driven largely by an 8.0 percent decline in processed energy goods. On the other hand, unprocessed goods for intermediate demand declined by 1.8 percent, largely due to a 6.6 percent drop in unprocessed energy materials.

Economic Implications

The decline in the PPI for May underscores several key economic trends and potential implications:

  1. Energy Sector Volatility: The substantial decrease in energy prices, especially gasoline and diesel, suggests volatility in the energy sector, which could be due to fluctuating global oil prices or changes in domestic production and inventory levels.

  2. Inflationary Pressures: While final demand goods prices have fallen, the unchanged prices in services indicate sustained demand and potentially ongoing inflationary pressures in parts of the economy not directly impacted by energy costs.

  3. Sector-Specific Impacts: The mixed performance across different sectors highlights the uneven recovery and challenges facing various industries. For example, while the food and alcohol retailing segments saw price increases, airline services and machinery and vehicle wholesaling faced declines.

Looking Ahead

As businesses and policymakers digest these figures, the PPI provides crucial insights into the pressures faced by producers which can eventually trickle down to consumer prices. The stability in services despite the drop in goods prices may cushion the overall economic impact in the short term. However, the ongoing volatility in energy prices remains a wild card that could influence future economic conditions.

In conclusion, the May PPI report serves as a vital barometer for economic health, offering a glimpse into the dynamics affecting producers that could shape policy decisions and market strategies in the coming months. With the next PPI release scheduled for July 12, 2024, all eyes will be on whether these trends continue, stabilize, or reverse, setting the stage for mid-year economic forecasts.

Source: https://www.bls.gov/news.release/ppi.nr0.htm


Start futures forex fx news trading with Haawks G4A low latency machine-readable data, one of the fastest machine-readable news trading feed for US economic and commodity data.

Please let us know your feedback. If you are interested in timestamps, please send us an email to sales@haawks.com.

Comment

Comment

12 pips potential profit in 8 seconds on 14 May 2024, analysis on futures forex fx low latency news trading USDJPY and EURUSD on US BLS Producer Price Index (PPI) data

According to our analysis USDJPY and EURUSD moved 12 pips on US BLS Producer Price Index (PPI) data on 14 May 2024.

USDJPY (3 pips)

EURUSD (9 pips)

Charts are exported from JForex (Dukascopy).


Analyzing the April 2024 Producer Price Index (PPI) Increase: Key Takeaways and Economic Implications

The U.S. Bureau of Labor Statistics recently released the Producer Price Index (PPI) for April 2024, revealing a notable uptick of 0.5 percent on a seasonally adjusted basis. This increase comes after a slight decline of 0.1 percent in March and marks the largest rise since February's 0.6 percent gain. Over the past 12 months, the unadjusted index for final demand has risen by 2.2 percent, representing the most substantial annual increase since April 2023.

Breakdown of Key Components

1. Services Drive the Increase

Nearly three-quarters of April's rise can be attributed to the services sector, which saw a 0.6 percent increase, primarily driven by a significant 3.9 percent jump in portfolio management costs. Other contributing factors include higher prices in machinery and equipment wholesaling, residential real estate services, and truck transportation of freight.

2. Goods Also Up

Final demand goods increased by 0.4 percent, primarily due to a 5.4 percent rise in gasoline prices, which accounted for most of the increase. Despite this, there was a contrasting decline in food prices, notably a steep 18.7 percent drop in fresh and dry vegetables.

Deeper Insights: Excluding Volatile Sectors

When excluding foods, energy, and trade services, the index still shows a robust increase of 0.4 percent in April, following a 0.2 percent rise in March. This indicator is particularly telling as it excludes sectors that are typically volatile, providing a clearer picture of the underlying inflation trends. Year-over-year, this measure has seen a 3.1 percent increase, the largest since April 2023.

Implications for Economic Policy and Business Planning

The latest PPI data suggests underlying inflationary pressures in the economy, particularly in the services sector. Businesses, especially in sectors directly impacted by rising service costs, will need to adjust their pricing strategies and budgeting plans to accommodate these cost increases. Moreover, policymakers may need to consider these trends when designing monetary policy to ensure inflation targets are met without stifling economic growth.

Future Outlook

Given the PPI's role as a leading indicator of consumer price inflation, the April increase might signal upcoming changes in consumer prices, potentially affecting the Federal Reserve's decisions on interest rates. The economic landscape remains dynamic, and these price trends provide critical insights into the broader economic health.

As we look forward to the May 2024 PPI report scheduled for release on June 13, businesses and policymakers alike must stay vigilant and responsive to these evolving economic indicators.

This data not only helps in anticipating economic trends but also serves as a crucial tool for financial planning and analysis, ensuring stakeholders are well-prepared to navigate the complexities of an ever-changing economic environment.

Source: https://www.bls.gov/news.release/ppi.nr0.htm


Start futures forex fx news trading with Haawks G4A low latency machine-readable data, one of the fastest machine-readable news trading feed for US economic and commodity data.

Please let us know your feedback. If you are interested in timestamps, please send us an email to sales@haawks.com.

Comment

Comment

35 pips potential profit in 18 seconds on 11 April 2024, analysis on futures forex fx low latency news trading USDJPY and EURUSD on US BLS Producer Price Index (PPI) data

According to our analysis USDJPY and EURUSD moved 35 pips on US BLS Producer Price Index (PPI) data on 11 April 2024.

USDJPY (19 pips)

EURUSD (16 pips)

Charts are exported from JForex (Dukascopy).


Unpacking the March 2024 Producer Price Index: A Subtle Shift in Economic Trends

In March 2024, the Producer Price Index (PPI) for final demand demonstrated a modest increase of 0.2 percent, seasonally adjusted, according to the latest report from the U.S. Bureau of Labor Statistics. This subtle uptick follows more significant rises in previous months—0.6 percent in February and 0.4 percent in January. Notably, this marked a slight cooling in the pace of price increases faced by producers in the United States. Here’s a deeper dive into the nuances of the March 2024 PPI report and what these figures could signify for the broader economy.

Overview of March 2024 PPI Increases

Over the past year, the unadjusted final demand index has grown by 2.1 percent, the largest 12-month advance since a 2.3 percent increase recorded in April 2023. This year-on-year growth is primarily driven by a 0.3 percent rise in prices for final demand services, contrasting with a slight decline of 0.1 percent in the index for final demand goods.

Detailed Insights:

  • Services Sector: The increase in services was broad-based, with significant contributions from sectors like securities brokerage, dealing, investment advice, and related services, which surged by 3.1 percent. This was balanced by a notable decline in traveler accommodation services, which dropped by 3.8 percent.

  • Goods Sector: The decline in goods was led by a 1.6 percent decrease in final demand energy prices, emphasizing the volatile nature of this category. On a positive note, prices for final demand foods rose by 0.8 percent, showing some sectors still face upward pricing pressures.

Core Inflation Measures

Stripping out the often volatile prices of food, energy, and trade services, the core PPI (final demand less foods, energy, and trade services) moved up by 0.2 percent in March, mirroring the general trend of modest inflation in more stable categories. This core measure has risen by 2.8 percent over the past 12 months, indicating a relatively steady inflationary environment in the core sectors of the economy.

Intermediate Demand Dynamics

The report also sheds light on intermediate demand, which tracks prices for goods, services, and construction products sold for resale, export, or as inputs to other products. In March, prices for processed goods for intermediate demand fell by 0.5 percent, largely due to a 1.5 percent drop in processed energy goods. This reflects broader declines in energy costs that could influence future final demand prices.

Conversely, prices for services for intermediate demand ticked up by 0.2 percent, supported by increases in sectors such as investment banking and metals wholesaling. These increases are important indicators of cost pressures within the service sector that could trickle down to consumer prices.

Implications for Business and Policy

For businesses, the fluctuating PPI indicates a mixed bag of cost pressures that could affect profit margins and pricing strategies. The rise in services costs, particularly in financial services, might lead to higher operational expenses, whereas the drop in goods prices, especially energy, could provide some relief.

From a policy perspective, the Federal Reserve and other policymakers will likely scrutinize these figures to assess inflationary trends and adjust monetary policy accordingly. The core PPI's steady rise suggests that underlying inflation pressures remain manageable, which could influence interest rate decisions in upcoming meetings.

Conclusion

The March 2024 PPI report highlights a complex economic landscape with divergent trends in goods and services. As we move further into 2024, businesses and policymakers must remain vigilant and adaptable to these evolving economic indicators. By understanding these trends, stakeholders can better navigate the uncertainties and opportunities that lie ahead in the dynamic U.S. economy.

Source: https://www.bls.gov/news.release/ppi.nr0.htm


Start futures forex fx news trading with Haawks G4A low latency machine-readable data, one of the fastest machine-readable news trading feed for US economic and commodity data.

Please let us know your feedback. If you are interested in timestamps, please send us an email to sales@haawks.com.

Comment

Comment

54 pips potential profit in 88 seconds on 13 July 2023, analysis on futures forex fx low latency news trading USDJPY and EURUSD on US Jobless Claims and US Producer Price Index (PPI) data

According to our analysis USDJPY and EURUSD moved 54 pips on US Jobless Claims and US Producer Price Index (PPI) data on 13 July 2023.

Start futures forex fx news trading with Haawks G4A low latency machine-readable data, the fastest machine-readable news trading feed for US economic and commodity data.

Please let us know your feedback. If you are interested in timestamps, please send us an email to sales@haawks.com.

USDJPY (38 pips)

EURUSD (16 pips)

Charts are exported from JForex (Dukascopy).

Comment

Comment

Analysis on forex fx news trading EURUSD, USDJPY and GBPUSD on US Jobless Claims and US PPI data, 14 pips profit in 30 seconds on 11 April 2019

According to our analysis EURUSD, USDJPY and GBPUSD moved 14 pips on US Jobless Claims and US PPI (Producer Price Index) data on 11 April 2019.

Start forex fx news trading with Haawks G4A low latency machine-readable data today, the fastest news data feed for US Jobless Claims data.

Please let us know your feedback. If you are interested in timestamps, please send us an email to sales@haawks.com.

EURUSD (4 pips)

Chart_EUR_USD_Ticks_snapshot.png

USDJPY (6 pips)

Chart_USD_JPY_Ticks_snapshot.png

GBPUSD (4 pips)

Chart_GBP_USD_Ticks_snapshot.png

Charts are exported from JForex (Dukascopy).

Comment

Comment

Haawks first on US PPI this week, 25 pips profit in 11 minutes

Starting this week we will share our research on market moving news releases. This includes macro economic news releases from the US and Canada as well as US releases on petroleum and grains.

According to our research EURUSD, USDJPY and GBPUSD moved 25 pips on US Producer Price Index (PPI) data.

Start forex news trading with Haawks G4A low latency data today.

EURUSD (13 pips)

Chart_EUR_USD_10 Secs_snapshot.png

USDJPY (12 pips)

Chart_USD_JPY_10 Secs_snapshot.png

GBPUSD (even)

Chart_GBP_USD_Ticks_snapshot.png

Charts are exported from JForex (Dukascopy).

Comment