Viewing entries tagged
DOE

Comment

35 ticks potential profit in 16 seconds on 12 December 2024, analysis on futures forex fx news trading natural gas on DOE Natural Gas Storage Report data

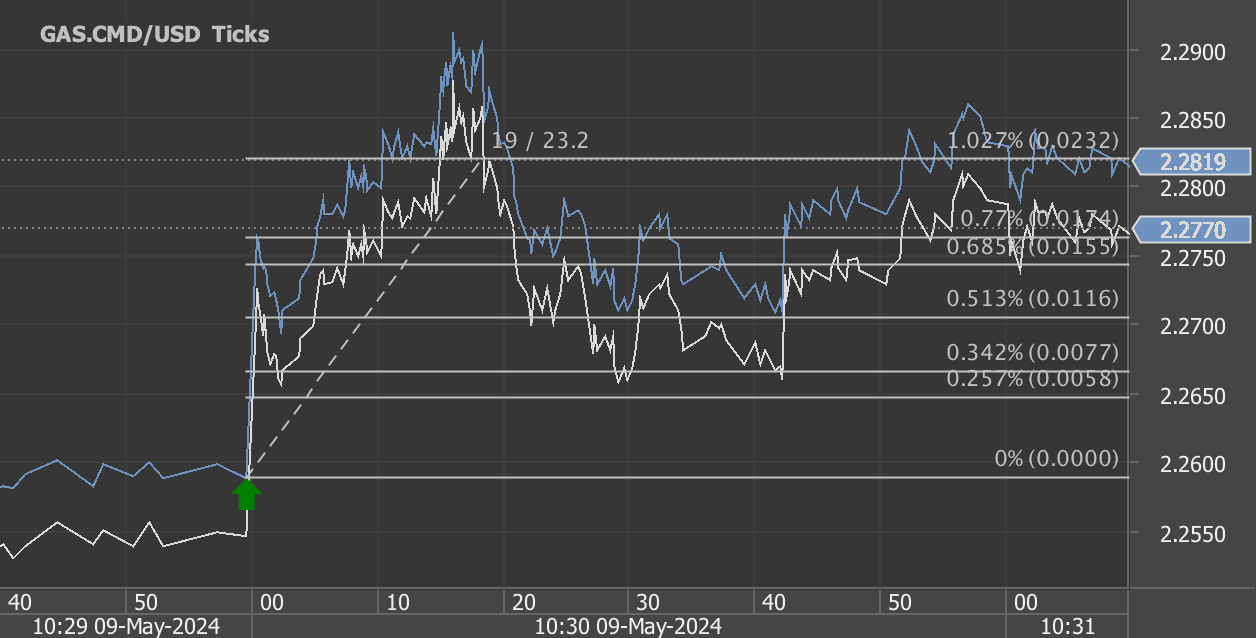
According to our analysis natural gas moved 35 ticks on DOE Natural Gas Storage Report data on 12 December 2024.

Natural gas (35 ticks)

Charts are exported from JForex (Dukascopy).


Weekly Natural Gas Storage Report Analysis for December 6, 2024

Released: December 12, 2024
Next Release: December 19, 2024

The Energy Information Administration (EIA) has released its latest Weekly Natural Gas Storage Report for the week ending December 6, 2024. This report provides valuable insights into natural gas inventories across the United States, helping analysts, traders, and policymakers understand supply and demand dynamics during the winter season.

Key Highlights

  • Total Working Gas in Storage: 3,747 billion cubic feet (Bcf)

  • Net Decrease: 190 Bcf from the previous week’s total of 3,937 Bcf

  • Year-Over-Year Comparison: 67 Bcf higher than the same period last year

  • Five-Year Average Comparison: 165 Bcf above the five-year average of 3,582 Bcf

At 3,747 Bcf, the current storage levels remain within the five-year historical range, indicating a relatively balanced inventory despite a notable weekly draw.

Summary of Regional Trends

  • East Region: The East saw a significant withdrawal of 58 Bcf, bringing current stocks to 856 Bcf. Compared to last year and the five-year average, this is a modest decrease of 0.7% and 0.3%, respectively.

  • Midwest Region: The Midwest experienced a 60 Bcf drawdown, reducing storage to 1,055 Bcf. Inventories are 0.8% lower than last year but still 1.9% above the five-year average.

  • Mountain Region: Despite a relatively small withdrawal of 7 Bcf, the Mountain region’s storage levels remain robust at 282 Bcf. This represents a 15.6% increase over last year and a 33% increase over the five-year average.

  • Pacific Region: The Pacific region saw an 8 Bcf draw, ending the week at 302 Bcf. Stocks are 4.5% higher than a year ago and 11.9% above the five-year average.

  • South Central Region: This region had the largest total withdrawal of 59 Bcf, bringing the total to 1,251 Bcf. Salt facilities contributed a 22 Bcf decline, while nonsalt facilities saw a 37 Bcf reduction. Despite the draw, stocks remain 2.4% higher than last year and 3.6% above the five-year average.

Key Insights and Market Implications

  1. Seasonal Draws Begin to Ramp Up: With winter demand in full swing, withdrawals are accelerating. The total net decrease of 190 Bcf underscores the increased consumption driven by colder weather.

  2. Healthy Inventories: Despite significant weekly draws, storage levels are still above both last year’s figures and the five-year average. This suggests a cushion against potential supply disruptions during peak winter demand.

  3. Regional Variations: The Mountain and Pacific regions continue to show robust storage levels compared to historical averages, while the East and Midwest are experiencing tighter supplies.

  4. Potential Market Impact: These storage dynamics can influence natural gas prices. Continued draws at this pace may push prices higher, particularly if cold weather persists.

Looking Ahead

The next report, scheduled for December 19, 2024, will provide further insights into how winter demand is impacting natural gas inventories. As we move deeper into the season, monitoring these weekly changes will be critical for assessing market stability and price trends.

Stay tuned for more updates and analysis!

Source: https://ir.eia.gov/ngs/ngs.html


Start futures forex fx commodity news trading with Haawks G4A low latency machine-readable data, one of the fastest data feeds for DOE data.

Please let us know your feedback. If you are interested in timestamps, please send us an email to sales@haawks.com.

Comment

Comment

34 ticks potential profit in 48 seconds on 24 October 2024, analysis on futures forex fx news trading natural gas on DOE Natural Gas Storage Report data

According to our analysis natural gas moved 34 ticks on DOE Natural Gas Storage Report data on 24 October 2024.

Natural gas (38 ticks)

Charts are exported from JForex (Dukascopy).


Weekly Natural Gas Storage Report: October 18, 2024 – Key Highlights and Insights

As we approach the colder months, the latest Weekly Natural Gas Storage Report released by the U.S. Energy Information Administration (EIA) offers crucial insights into the current state of natural gas reserves. For the week ending October 18, 2024, working gas in underground storage across the Lower 48 states reached 3,785 billion cubic feet (Bcf), representing a net increase of 80 Bcf compared to the previous week. This puts total storage levels 106 Bcf higher than the same period last year and 167 Bcf above the five-year average.

Regional Breakdown and Implied Flows

The report highlights steady growth in gas reserves across various regions:

  • East Region: The working gas in storage increased by 8 Bcf to reach 901 Bcf, which is slightly below last year’s figure of 905 Bcf, representing a small 0.4% decrease. However, it remains 1.9% above the five-year average of 884 Bcf.

  • Midwest Region: A significant uptick of 21 Bcf brought storage to 1,088 Bcf. This represents a 1.9% increase from last year and a 3.0% increase over the five-year average of 1,056 Bcf, signaling healthy storage levels in this critical region.

  • Mountain Region: Although the region saw a smaller increase of 4 Bcf, its reserves now stand at 291 Bcf, marking a substantial 15.9% growth compared to last year and a 30.5% rise over the five-year average, which sits at 223 Bcf. This is one of the most pronounced increases of all regions.

  • Pacific Region: With an additional 7 Bcf, the Pacific region’s gas reserves are now at 300 Bcf. This is 6.4% higher than last year’s 282 Bcf and 6.8% above the five-year average of 281 Bcf.

  • South Central Region: The largest weekly net change came from the South Central region, where storage levels increased by 39 Bcf, reaching a total of 1,205 Bcf. This includes a 21 Bcf increase in salt-dome storage, now at 314 Bcf, and a 19 Bcf increase in nonsalt storage, bringing that total to 891 Bcf. The region is performing 2.7% better than last year and is 2.6% above the five-year average.

Total Storage and Implications

At 3,785 Bcf, total working gas in storage is comfortably within the five-year historical range. This storage level provides a cushion as we head into the winter heating season, where demand typically spikes. The net increase of 80 Bcf from the prior week is a healthy signal that the market is preparing adequately for potential weather-driven demand surges in the coming months.

The 106 Bcf year-over-year surplus and 167 Bcf surplus over the five-year average indicate robust storage levels, which should help moderate price volatility as temperatures drop and heating demand rises. With winter approaching, natural gas storage figures will be critical in determining price stability and supply adequacy in the coming months.

Key Takeaways:

  1. Healthy Storage Levels: The 3,785 Bcf in storage positions the market well for the winter season, with a notable 106 Bcf increase over last year.

  2. Regional Variations: Some regions, like the Mountain and Pacific, are showing significant year-over-year increases, reflecting improved storage capabilities and preparedness.

  3. Implied Flow of 80 Bcf: The overall weekly increase of 80 Bcf is consistent with seasonal storage trends and ensures a stable supply going into winter.

  4. Price and Supply Outlook: With storage levels above historical averages, there’s a strong foundation to mitigate supply concerns and manage price spikes that may arise from unexpected weather events or surges in demand.

The next release on October 31, 2024, will offer further insight as we monitor natural gas reserves closely during this critical period. Stay tuned for updates, as storage dynamics play a crucial role in the natural gas market and energy planning throughout the winter season.

Source: https://ir.eia.gov/ngs/ngs.html


Start futures forex fx commodity news trading with Haawks G4A low latency machine-readable data, one of the fastest data feeds for DOE data.

Please let us know your feedback. If you are interested in timestamps, please send us an email to sales@haawks.com.

Comment

Comment

38 ticks potential profit in 46 seconds on 15 August 2024, analysis on futures forex fx news trading natural gas on DOE Natural Gas Storage Report data

According to our analysis natural gas moved 38 ticks on DOE Natural Gas Storage Report data on 15 August 2024.

Natural gas (38 ticks)

Charts are exported from JForex (Dukascopy).


Weekly Natural Gas Storage Report: Slight Decline in Working Gas Stocks Amid Seasonal Variations

The U.S. Energy Information Administration (EIA) has released its latest Weekly Natural Gas Storage Report for the week ending August 9, 2024. The report indicates a slight decrease in the total working gas in storage across the Lower 48 states, with key regional variations highlighting the ongoing dynamics in the natural gas market.

Key Figures from the Report:

  • Total Working Gas: As of August 9, 2024, the total working gas in underground storage was 3,264 billion cubic feet (Bcf), reflecting a net decrease of 6 Bcf from the previous week’s level of 3,270 Bcf.

  • Year-over-Year Comparison: The current storage level is 209 Bcf higher than the same period last year, marking a 6.8% increase. Moreover, it is 375 Bcf above the five-year average of 2,889 Bcf, a significant 13.0% surplus.

  • Regional Insights:

    • East: The East region saw a modest increase of 4 Bcf, bringing its total to 723 Bcf. This is 1.5% higher than last year and 9.9% above the five-year average.

    • Midwest: The Midwest experienced the largest net increase, with 15 Bcf added, raising its total to 869 Bcf. This represents a 7.7% increase from last year and a 13.6% rise compared to the five-year average.

    • Mountain: The Mountain region’s storage grew by 3 Bcf to 260 Bcf, a remarkable 30.0% higher than last year and 43.6% above the five-year average.

    • Pacific: Contrarily, the Pacific region saw a net decrease of 2 Bcf, bringing its storage down to 287 Bcf. Despite this decline, the region’s storage remains 20.6% higher than last year and 9.1% above the five-year average.

    • South Central: The South Central region experienced the most significant decline, with a 27 Bcf drop in storage, bringing the total to 1,125 Bcf. This region includes salt and nonsalt storage facilities, which saw decreases of 14 Bcf and 12 Bcf, respectively. Despite the decrease, the region’s storage is still 2.6% higher than last year and 10.2% above the five-year average.

Analysis and Implications:

The slight overall decrease of 6 Bcf in working gas stocks this week can be attributed to seasonal fluctuations and regional demand variations. The data reveals a complex picture, where some regions, like the Midwest and Mountain, have seen substantial increases, while others, particularly the South Central region, have experienced notable declines.

The South Central region’s significant reduction is noteworthy, as it typically plays a critical role in balancing supply and demand, particularly during the high-demand periods in the winter. The drop in this region may reflect current consumption trends or changes in production patterns.

Conversely, the increases in the Midwest and Mountain regions suggest a buildup of reserves in preparation for the upcoming winter season. The high levels in the Mountain region, in particular, may indicate strategic storage aimed at mitigating any potential supply disruptions or price volatility.

The overall surplus of 375 Bcf above the five-year average provides a buffer that could help stabilize prices and supply during periods of high demand. However, the variations between regions underscore the importance of monitoring these trends closely, as they could impact local markets differently.

Looking Ahead:

As we approach the end of summer and transition into the cooler months, the trends in natural gas storage will be crucial for forecasting winter energy markets. The current surplus is a positive indicator, but continued monitoring of regional storage levels and production rates will be essential to ensure market stability.

Energy traders, policymakers, and consumers should keep an eye on upcoming reports, especially as they may reflect the early impacts of seasonal demand increases and potential weather-related disruptions.

Stay tuned for next week’s report, which will be released on August 22, 2024, to see how these trends evolve as we move closer to the high-demand winter season.

Source: https://ir.eia.gov/ngs/ngs.html


Start futures forex fx commodity news trading with Haawks G4A low latency machine-readable data, one of the fastest data feeds for DOE data.

Please let us know your feedback. If you are interested in timestamps, please send us an email to sales@haawks.com.

Comment

Comment

40 ticks potential profit in 26 seconds on 25 July 2024, analysis on futures forex fx news trading natural gas on DOE Natural Gas Storage Report data

According to our analysis natural gas moved 40 ticks on DOE Natural Gas Storage Report data on 25 July 2024.

Natural gas (40 ticks)

Charts are exported from JForex (Dukascopy).


Understanding the Latest Trends in Natural Gas Storage

In the most recent Weekly Natural Gas Storage Report released on July 25, 2024, covering data up to the week ending July 19, 2024, we observe a detailed overview of the natural gas inventories across the United States. The Energy Information Administration (EIA) provides a comprehensive breakdown that not only informs stakeholders but also hints at broader economic implications.

Key Findings from the Report

  • Total Working Gas Increase: The total working gas in the underground storage was reported at 3,231 billion cubic feet (Bcf), marking an increase of 22 Bcf from the previous week. This suggests a slightly higher than expected accumulation, considering the week-on-week data.

  • Yearly and Historical Comparisons: When compared to the same period last year, current stocks are higher by 249 Bcf. Moreover, when measured against the five-year average from 2019 to 2023, stocks are up by 456 Bcf. These figures indicate a robust stockpiling activity that outpaces both last year’s figures and the longer-term average.

  • Regional Breakdown:

    • East: The East showed an increase to 697 Bcf, up from 686 Bcf the previous week.

    • Midwest: Stocks rose to 827 Bcf from 814 Bcf, showcasing a substantial net change.

    • Mountain: This region’s stocks saw a smaller increase, rising modestly from 248 Bcf to 251 Bcf.

    • Pacific: Remained steady at 289 Bcf, indicating stability in this region’s gas storage.

    • South Central: Interestingly, this region reported a slight decrease, down 6 Bcf from the previous week.

  • Coefficient of Variation and Standard Error: The coefficient of variation, an indicator of the variability relative to the mean of the dataset, remains low across the board, suggesting that the storage volumes are not prone to large swings, thus providing some stability in supply expectations.

Implications for Markets and Policy

The above-average stock levels relative to both last year and the five-year average can have several implications:

  • Market Impact: Higher storage levels typically moderate natural gas prices due to increased supply security. This could influence everything from residential heating costs to the operational costs for industries reliant on natural gas.

  • Policy Considerations: With an ongoing robust supply, policy makers might look at opportunities to adjust export levels or reconsider strategies for sustainable energy utilization.

Conclusion

As we head towards the latter part of 2024, the natural gas storage levels are demonstrating a significant cushion compared to historical levels. This robustness in natural gas storage not only helps in stabilizing prices but also plays a critical role in energy security during peak demand periods like winter. Going forward, stakeholders will be keenly watching the trends to gauge the potential economic and environmental impacts of these stock levels.

For more detailed insights and implications, stakeholders are encouraged to stay tuned for the next release on August 1, 2024, which will further shape the understanding of natural gas trends and strategic responses.

Source: https://ir.eia.gov/ngs/ngs.html


Start futures forex fx commodity news trading with Haawks G4A low latency machine-readable data, one of the fastest data feeds for DOE data.

Please let us know your feedback. If you are interested in timestamps, please send us an email to sales@haawks.com.

Comment

Comment

32 ticks potential profit in 58 seconds on 18 July 2024, analysis on futures forex fx news trading natural gas on DOE Natural Gas Storage Report data

According to our analysis natural gas moved 32 ticks on DOE Natural Gas Storage Report data on 18 July 2024.

Natural gas (32 ticks)

Charts are exported from JForex (Dukascopy).


Weekly Natural Gas Storage Update - July 18, 2024

The latest data from the Energy Information Administration (EIA) provides an insightful snapshot into the state of natural gas storage across the United States as of the week ending July 12, 2024. Let’s dive into the numbers and understand what they signify for the energy sector and, more broadly, for the economy.

Current Natural Gas Storage Figures

As per the EIA report released today, total working gas in underground storage stood at 3,209 billion cubic feet (Bcf) as of July 12, 2024. This represents a slight increase of 10 Bcf from the previous week. When compared to the figures from the same time last year, the current storage levels are 250 Bcf higher. Moreover, they surpass the five-year average (2019-2023) by 465 Bcf. This indicates a robust inventory that exceeds typical seasonal levels.

Here's a regional breakdown of the storage data:

  • East: Current stocks are at 686 Bcf, showing a minor weekly increase and being notably higher than both last year’s and the five-year average figures.

  • Midwest: Stocks increased by 14 Bcf over the week, totaling 814 Bcf. This region also exhibits a strong year-on-year growth and significantly outpaces the five-year average.

  • Mountain: Storage stands at 248 Bcf, with a weekly increase and dramatic increases over past figures, reflecting perhaps the most substantial relative growth among the regions.

  • Pacific: Stable week-over-week at 289 Bcf but substantially higher than previous year and five-year averages.

  • South Central: This region saw a decrease in storage, mainly in the salt facilities, which might indicate specific regional dynamics such as increased withdrawals or decreased injections.

Analysis

The overall increase in natural gas stocks can be attributed to a combination of factors including mild weather reducing heating demand, efficient production rates, and possibly strategic injections anticipating future demand. The substantial surplus relative to both last year and the five-year average provides a cushion that might help in stabilizing natural gas prices, offering some relief to consumers and industries reliant on natural gas.

However, the regional variations highlight different dynamics possibly driven by local weather conditions, demand fluctuations, and infrastructural factors. For instance, the notable increase in the Mountain region might reflect specific local market conditions or response strategies to anticipated regional demand.

Market Implications

Higher-than-average gas storage levels typically exert downward pressure on natural gas prices due to the law of supply and demand. Investors and market analysts closely watch these figures as they can influence not only energy markets but also broader economic conditions. Lower natural gas prices can reduce energy costs for industries and households, contributing to lower overall inflationary pressures in the economy.

Looking Ahead

The next update is scheduled for July 25, 2024. Market participants will be keen to see if the trend of building inventories continues or if there are shifts in the pattern that could suggest changes in market dynamics. Meanwhile, stakeholders would do well to monitor weather forecasts and any geopolitical developments that could impact energy markets.

In conclusion, this week's report underscores a strong position for natural gas storage, which could bode well for maintaining energy security and economic stability in the upcoming months. As always, it will be important to monitor these trends closely to adapt to the ever-evolving energy landscape.

Source: https://ir.eia.gov/ngs/ngs.html


Start futures forex fx commodity news trading with Haawks G4A low latency machine-readable data, one of the fastest data feeds for DOE data.

Please let us know your feedback. If you are interested in timestamps, please send us an email to sales@haawks.com.

Comment

Comment

40 ticks potential profit in 37 seconds on 6 June 2024, analysis on futures forex fx news trading natural gas on DOE Natural Gas Storage Report data

According to our analysis natural gas moved 40 ticks on DOE Natural Gas Storage Report data on 6 June 2024.

Natural gas (40 ticks)

Charts are exported from JForex (Dukascopy).


Weekly Update on U.S. Natural Gas Storage: Trends and Insights as of May 31, 2024

As we close another week, the U.S. Energy Information Administration (EIA) has released its latest Natural Gas Storage Report. This week's data, ending on May 31, 2024, reveals significant trends in the storage of working gas, reflecting both seasonal influences and broader market dynamics.

Current Storage Figures and Regional Breakdown

As of May 31, total working gas in underground storage across the Lower 48 states stood at 2,893 billion cubic feet (Bcf). This is a robust increase of 98 Bcf from the previous week. When we delve into regional data, the distribution and changes become even more insightful:

  • East: Stocks reached 575 Bcf, with an impressive weekly increase of 37 Bcf.

  • Midwest: Storage levels rose to 681 Bcf, marking a rise of 29 Bcf over the last week.

  • Mountain: Smaller but still significant, stocks are at 218 Bcf, up 8 Bcf.

  • Pacific: Recorded a modest rise of 6 Bcf to reach 273 Bcf.

  • South Central: Demonstrating the largest regional storage, totals hit 1,146 Bcf, with an increase of 18 Bcf.

These figures underscore a noteworthy increase in storage levels across most regions, particularly in areas like the Pacific and Mountain regions, where percentage increases far outpace other regions.

Historical Comparisons and Market Implications

The current total storage of 2,893 Bcf not only surpasses last week's figures but also shows significant gains over historical benchmarks. This total is 373 Bcf higher than the same time last year and 581 Bcf above the five-year average of 2,312 Bcf. Such a position above the historical average suggests a robust supply scenario which could influence market sentiments and pricing strategies in the natural gas markets.

  • Year-over-Year: Each region has shown growth compared to last year, with the Mountain and Pacific regions reporting the most substantial relative increases (62.7% and 70.6%, respectively).

  • Against the Five-Year Average: Here too, the Mountain and Pacific regions standout with increases of 67.7% and 21.3%, respectively, showcasing a trend of growing stockpiles that may impact future supply availability and pricing.

Statistical Considerations

The EIA report also touches on the accuracy and reliability of these figures. The coefficients of variation (CV) for stocks indicate the reliability of the reported quantities. For most regions, the CV remains low, suggesting a high level of confidence in these measurements. Particularly notable is the Pacific region's 0.0% CV, indicating highly reliable data.

Market Outlook

Given the current data, market participants might anticipate stable or potentially lower natural gas prices, barring any unforeseen shifts in market demand or supply disruptions. The significant increase above the five-year average provides a cushion that could help mitigate price volatility in the short term.

In conclusion, the latest report on natural gas storage indicates a healthy supply situation in the U.S. As we head into the summer months, where consumption typically rises, the industry appears well-prepared to meet demand. However, stakeholders should continue to monitor weekly trends and other market indicators to refine their strategies in this dynamic market environment.

Source: https://ir.eia.gov/ngs/ngs.html


Start futures forex fx commodity news trading with Haawks G4A low latency machine-readable data, one of the fastest data feeds for DOE data.

Please let us know your feedback. If you are interested in timestamps, please send us an email to sales@haawks.com.

Comment

Comment

45 ticks potential profit in 16 seconds on 23 May 2024, analysis on futures forex fx news trading natural gas on DOE Natural Gas Storage Report data

According to our analysis natural gas moved 45 ticks on DOE Natural Gas Storage Report data on 23 May 2024.

Natural gas (45 ticks)

Charts are exported from JForex (Dukascopy).


Weekly Natural Gas Storage Update: Significant Inventory Growth

The latest data from the U.S. Energy Information Administration (EIA) for the week ending May 17, 2024, reveals a substantial increase in natural gas stocks, indicating strong trends in gas storage across the United States. Here's an insightful overview of the key findings from the report released on May 23, 2024.

Overview of Natural Gas Stocks

As of May 17, 2024, working gas in underground storage totaled 2,711 billion cubic feet (Bcf), marking a significant net increase of 78 Bcf from the previous week. This current stock is not only 402 Bcf higher than the same time last year but also 606 Bcf above the five-year average, which sits at 2,105 Bcf. These figures suggest a robust storage scenario that exceeds historical norms.

Regional Insights

The distribution of storage increases across the different regions is as follows:

  • East: Storage rose to 511 Bcf, up by 29 Bcf, reflecting a 6.5% increase from last year and a 28.1% surge over the five-year average.

  • Midwest: Here, stocks reached 628 Bcf, with a 22 Bcf increase from the previous week. This represents a 16.5% increase year-over-year and a 33.6% jump from the five-year average.

  • Mountain: Stocks stood at 202 Bcf, up 6 Bcf for the week, and showing the most significant percentage increase—71.2% from last year and 74.1% over the five-year average.

  • Pacific: Increased by 7 Bcf to 259 Bcf, up a dramatic 90.4% from last year and 27% from the five-year average.

  • South Central: The largest regional storage, tallying at 1,112 Bcf after a 15 Bcf increase, with a 7.2% rise from last year and 21.3% above the five-year average.

These figures point to a growing trend in natural gas storage, reflecting potential shifts in both market dynamics and consumption patterns.

Statistical Confidence

The EIA report also provides estimated measures of sampling variability. Notably, the coefficients of variation for stocks in regions like the East and Midwest are relatively low, indicating high confidence in these measurements. Specifically, the total coefficient of variation stands at 0.4%, demonstrating the robustness of the overall data.

Market Implications

This notable increase in gas stocks might influence natural gas prices and market strategies. Higher storage levels typically translate into more stable prices, but the current levels surpassing the five-year averages substantially could hint at potential downward pressures on natural gas prices in the short term.

Looking Ahead

As the storage levels continue to climb, market participants will be closely monitoring the trends for implications on supply and pricing. The next update, scheduled for release on May 30, 2024, will be eagerly awaited for further insights into the trajectory of natural gas storage and its broader economic impacts.

In summary, the natural gas storage report highlights a robust increase in stocks, well above year-ago and five-year average levels, signaling strong supply conditions and potential shifts in the energy market landscape. Stay tuned for further updates as the situation evolves.

Source: https://ir.eia.gov/ngs/ngs.html


Start futures forex fx commodity news trading with Haawks G4A low latency machine-readable data, one of the fastest data feeds for DOE data.

Please let us know your feedback. If you are interested in timestamps, please send us an email to sales@haawks.com.

Comment

Comment

24 ticks potential profit in 31 seconds on 16 May 2024, analysis on futures forex fx news trading natural gas on DOE Natural Gas Storage Report data

According to our analysis natural gas moved 24 ticks on DOE Natural Gas Storage Report data on 16 May 2024.

Natural gas (24 ticks)

Charts are exported from JForex (Dukascopy).


Navigating the Surge in Natural Gas Storage: Analysis of the Latest EIA Weekly Report

As of May 10, 2024, the Energy Information Administration (EIA) has released its latest Weekly Natural Gas Storage Report, marking a notable increase in natural gas inventories. Here's a comprehensive breakdown of the data and what it implies for the market and policy-making.

Overview of Current Gas Stocks

The total working gas in underground storage across the Lower 48 states stood at 2,633 billion cubic feet (Bcf), as per the latest EIA estimates. This figure represents an increase of 70 Bcf over the previous week. When compared to the same week last year and against the five-year average, the current stocks are substantially higher—421 Bcf and 620 Bcf respectively. Such a significant increase not only highlights a robust replenishment but also sets a new precedent above the historical five-year range.

Regional Insights

  • East: Stocks rose to 482 Bcf, up by 28 Bcf from the previous week. This is significantly higher compared to both last year's and the five-year average figures.

  • Midwest: Here, inventories have seen an increase to 606 Bcf, up 22 Bcf week-over-week, with a notable 35.9% increase over the five-year average.

  • Mountain: This region’s stocks are at 196 Bcf, a modest increase but nearly double the five-year average, signaling unusual stockpiling activity.

  • Pacific: Reported at 252 Bcf, the stocks have surpassed last year’s numbers by a staggering 104.9%.

  • South Central: Totaling 1,097 Bcf, with a nuanced detail between salt (313 Bcf) and nonsalt (784 Bcf) facilities showing a diverse storage strategy.

Implications for the Market

The significant surplus relative to historical averages suggests several market dynamics. Firstly, it may indicate lesser demand due to mild weather conditions or increased efficiency in energy use. Alternatively, it might reflect a strategic buildup in anticipation of higher future demand or as a hedge against geopolitical uncertainties affecting supply lines.

The regional data provide deeper insights; for instance, the extraordinary increase in the Pacific and Mountain regions might be driven by specific local factors or infrastructural developments. Investors and analysts would do well to watch these trends for indications of regional demand shifts or supply chain bottlenecks.

Policy and Economic Impacts

From a policy standpoint, the current levels of gas storage offer a buffer that can help manage price stability and energy security. However, such high levels might also dampen prices, potentially impacting producers' profitability and future investment in gas exploration and production. Regulators and policymakers must balance these aspects to optimize national energy strategies.

Forward Outlook

Looking ahead, market participants and regulators will need to keep a close eye on upcoming weekly reports and other market indicators to gauge the trend's sustainability. The next report, due on May 23, 2024, will be particularly scrutinized to see if the trend of stock buildups continues or stabilizes.

In conclusion, while the current high storage levels suggest a strong supply situation, the implications for prices, market dynamics, and policy-making are complex and must be navigated with careful analysis and foresight.

Source: https://ir.eia.gov/ngs/ngs.html


Start futures forex fx commodity news trading with Haawks G4A low latency machine-readable data, one of the fastest data feeds for DOE data.

Please let us know your feedback. If you are interested in timestamps, please send us an email to sales@haawks.com.

Comment

Comment

33 ticks potential profit in 29 seconds on 15 May 2024, analysis on futures forex fx low latency news trading crude oil on DOE Petroleum Status Report data

According to our analysis crude oil moved 33 ticks on DOE Petroleum Status Report data on 15 May 2024.

Light sweet crude oil (17 ticks)

Brent crude oil (16 ticks)

Charts are exported from JForex (Dukascopy).


Analyzing the Latest Trends in U.S. Petroleum Data as of May 2024

The latest Weekly Petroleum Status Report from the U.S. Energy Information Administration provides key insights into the petroleum market for the week ending May 10, 2024. As energy markets fluctuate, this data is crucial for understanding the current state of supply, demand, and pricing within the sector.

Refinery Inputs and Capacity Utilization

U.S. crude oil refinery inputs showed a significant increase, averaging 16.3 million barrels per day, up by 307,000 barrels from the previous week. This indicates a robust demand for refining capacity, which operated at an impressive 90.4% of its total available capacity. This high utilization rate suggests that refineries are ramping up operations possibly in response to anticipated demand or attractive margins on refined products.

Production Increases

Both gasoline and distillate fuel production saw increases last week. Gasoline production rose to an average of 9.7 million barrels per day, while distillate fuel production, which includes diesel and heating oil, also increased to 4.8 million barrels per day. These increases are indicative of refineries adjusting outputs to meet shifting market demands or to replenish inventories.

Import and Inventory Shifts

Interestingly, U.S. crude oil imports averaged 6.7 million barrels per day last week, marking a decrease of 226,000 barrels per day compared to the previous week. Over the last four weeks, however, imports have shown an overall increase of 7.1% compared to the same period last year. This rise could be attributed to various factors including pricing arbitrage opportunities or efforts to bolster reserves.

U.S. commercial crude oil inventories decreased by 2.5 million barrels, underscoring a drawdown that positions current stocks about 4% below the five-year average for this time of year. This reduction in crude inventories could be a sign of stronger demand or a strategic inventory management by market participants.

Fuel Stock and Prices

While total motor gasoline inventories slightly declined, distillate fuel inventories experienced a slight decrease, staying about 7% below the five-year average. This lower inventory level for distillates might signal tightness in the diesel market, possibly leading to higher future prices if the trend continues.

Propane/propylene inventories increased by 2.9 million barrels and are notably 14% above the five-year average. This could be due to lower demand or increased production, leading to higher stocks.

Price Movements

The price for West Texas Intermediate crude settled at $79.81 per barrel, marking a modest increase from the previous week and a significant rise compared to last year. Retail gasoline prices have seen a decline from last week, although they remain slightly higher than the previous year's figures. This could reflect the recent changes in crude prices and refinery outputs.

Conclusion

The data from the week ending May 10, 2024, highlights several important trends in the U.S. petroleum market. Increased refinery output and capacity utilization coupled with fluctuating imports and inventories suggest a dynamic market adjusting to both domestic and international pressures. Prices are reflecting these shifts, with notable implications for consumers and businesses alike. As the market continues to evolve, it will be important to monitor these trends for a deeper understanding of the broader economic landscape influenced by energy commodities.

Source: https://www.eia.gov/petroleum/supply/weekly/pdf/highlights.pdf


Start futures forex fx crude oil news trading with Haawks G4A low latency machine-readable data, one of the fastest data feeds for DOE Petroleum Status Report data.

Please let us know your feedback. If you are interested in timestamps, please send us an email to sales@haawks.com.

Comment

Comment

23 ticks potential profit in 19 seconds on 9 May 2024, analysis on futures forex fx news trading natural gas on DOE Natural Gas Storage Report data

According to our analysis natural gas moved 23 ticks on DOE Natural Gas Storage Report data on 9 May 2024.

Natural gas (23 ticks)

Charts are exported from JForex (Dukascopy).


U.S. Natural Gas Storage Update: Significant Stock Increases

As of May 3, 2024, the United States has seen a notable increase in its natural gas storage, according to the latest Weekly Natural Gas Storage Report released by the Energy Information Administration (EIA). The report, which provides an insightful snapshot into the nation's energy reserves, highlights a substantial storage volume of 2,563 billion cubic feet (Bcf). This represents a significant weekly increase of 79 Bcf, underscoring a robust addition to the nation's energy reserves.

Regional Breakdown and Historical Comparisons

The storage levels vary significantly across different regions:

  • East: The Eastern region now holds 454 Bcf, marking a substantial weekly increase of 29 Bcf. This volume is notably higher than the previous year's 419 Bcf and surpasses the five-year average of 351 Bcf by a remarkable 29.3%.

  • Midwest: This region shows a robust increase, with current stocks at 584 Bcf compared to 492 Bcf a year ago—an 18.7% increase. The figure also exceeds the five-year average by 37.7%.

  • Mountain: Here, the stocks stand at 191 Bcf, up from 101 Bcf last year, showcasing a dramatic year-over-year rise of 89.1%. The volume is also well above the five-year average by 85.4%.

  • Pacific: Stocks have reached 246 Bcf, up from last year’s 110 Bcf, marking a striking increase of 123.6% above the prior year and 35.2% over the five-year average.

  • South Central: Totaling 1,087 Bcf, this region's stocks have risen by 14 Bcf over the week, with a notable 9.2% increase over the previous year and a 26.1% rise above the five-year average.

Specifically, within the South Central region, the nonsalt facilities saw a noteworthy increase, reflecting a broader trend of robust inventory building across various storage types.

Implications for Energy Markets

The current levels of working gas in underground storage are substantially above both last year’s figures and the five-year average. This increased stock could suggest a more secure energy landscape in the U.S. for the short term, potentially stabilizing natural gas prices and offering some buffer against supply disruptions.

Moreover, the high storage levels are likely to play a crucial role in managing seasonal demand fluctuations, especially as the country approaches the high-demand summer months. Utilities and energy providers may find some relief in these figures, as ample storage typically translates into more manageable costs for end consumers.

Looking Ahead

With the next update scheduled for May 16, 2024, market participants and analysts will be keenly watching for signs of continued stock building or any adjustments in the flow dynamics. The detailed regional data will also help in assessing the local impacts on energy markets, crucial for local distributors and consumers alike.

In conclusion, the EIA’s latest report not only reflects a positive trend in natural gas availability but also underscores the resilience and strategic management of energy resources within the U.S. As stakeholders continue to navigate through the complexities of energy supply and demand, these storage figures provide a critical data point in the broader energy discourse.

Source: https://ir.eia.gov/ngs/ngs.html


Start futures forex fx commodity news trading with Haawks G4A low latency machine-readable data, one of the fastest data feeds for DOE data.

Please let us know your feedback. If you are interested in timestamps, please send us an email to sales@haawks.com.

Comment